
Contents
2021 Community Workshop Report
This workshop brought together the Seafloor Geodesy community, including scientists from academic institutions, government agencies, and international partners. We are now excited to present the workshop report in its entirety. Please use the navigational bar to the left and if you would like to download a copy of the report in PDF you can do so HERE.
1. Introduction and Motivation
Seafloor geodetic techniques allow for measurements of crustal deformation over ∼70% of Earth’s surface and 90% of plate boundaries that are inaccessible using standard tools of tectonic geodesy. Over the past three decades, advances made by using space geodetic systems, such as the global navigation satellite system (GNSS) and interferometric synthetic aperture radar (InSAR), have revolutionized our ability to precisely track actively deforming subaerial areas with high spatial and temporal resolution. These geodetic measurements of the Earth’s surface have revealed important information about the motion of tectonic plates, the distributed deformation at plate boundary zones, and the dynamics of the earthquake cycle and of active volcanic systems, as well as a range of non-tectonic deformation processes. Many deformation sources and key dynamic processes operating within and around them are located partially, or wholly underwater (e.g. subduction zones, mid-ocean ridges, some tectonic plates, and undersea/island volcanoes). The fundamental limitations imposed by land-only observation systems mean that there will always be significant uncertainty in our ability to model and interpret these processes. Additionally, there may be signals we have not yet anticipated or have been unable to detect at all with land-based measurements. The solution to this problem, and the next step forward that will revolutionize geodetic science in a way similar to the impact of GNSS and InSAR, is to expand our observing capacity to include seafloor observations with spatial and temporal resolutions appropriate for the signals being measured.
The key development work that has produced the current state of the art for seafloor geodetic instrumentation, observing strategies, and data processing has been led by a small number of researchers from a handful of institutions in the USA and around the world (detailed below). The high costs for instruments and ship time, and the specialized technical expertise and engineering support needed have continued to limit the access of researchers in this field. A convergence of many factors has led to this opportunity to bring global leaders in this area together with members of the broader community interested in greater involvement. These factors include reduced instrument and operations costs, and increasing interest and momentum within the geodetic community to embrace seafloor geodesy. The Future Directions for Seafloor Geodesy Community Workshop was convened to identify the interested community and bring them together to decide a utilization strategy for the new instrument pool, to examine the primary motivating science and hazards applications, to identify future technologies and opportunities that can spur innovation in seafloor geodesy, and to identify a path forward for the US that will greatly expand involvement, investment, and innovation in seafloor geodesy.
1.1 Seafloor Geodetic Techniques:
A diverse range of techniques and instruments have been developed and deployed over the last two decades to measure geodetic signals on the seafloor (Bürgmann and Chadwell, 2014). These can be broadly categorized as resolving predominantly either vertical or horizontal signals. Figure 1 provides a schematic overview of most of these techniques, and the range of spatial and temporal scales over which they can resolve displacement signals of 1 cm.
Vertical control A range of terrestrial sensors providing vertical control have been adapted for seafloor use. Sensors for measuring gravity and tilt have been enclosed in air-filled, watertight vessels that maintain the internal air pressure at nominally 1 atm. A variety of relative gravimeters have been used on the seafloor (Zumberge et al. 2008). Short-baseline tilt sensors
measure the tilt over the approximately 1-m-wide aperture of the sensor frame (Fabian & Villinger 2008). Although resolution approaches 0.1 μrad/day, long-term drift limits applications to concentrated strain events and coupling of the instrument to the seafloor can be disturbed by water movement (Anderson et al. 1997, Tolstoy et al. 1998). Borehole tiltmeters (McGuire et al., 2018) minimize influence of water column effects and seafloor coupling, and may allow better resolution of transient deformation events than seafloor-based systems, though borehole systems are currently more expensive and difficult to implement widely. The most mature technology for measuring vertical displacements on the seafloor is based on the absolute pressure gauge (APG). This approach has been used at Axial Volcano since the late 1980’s to resolve the episodes of inflation and deflation produced by its eruption cycle (Fox, 1993; Nooner et al., 2009; Chadwick et al., 2012). Other volcanoes have also been observed (Ballu et al.; 2008; 2013) and pressure sensors have proved their value for recording the vertical motions from both earthquakes, slow slip events, and large secular slips processes (e.g. Phillips et al., 2008; Susuki et al., 2016; Wallace et al., 2016). The biggest limitations for these measurements include oceanographic noise and instrument drift which can be at several to tens of cm/yr. The development of a drift-free or self-calibrated pressure gauge, reduces this to 1 cm/yr or better. Sasagawa & Zumberge (2013) have developed a calibration system that is deployed with the gauge., and Willcock and others (2021) have demonstrated that this approach can indeed reduce the impact of the sensor drift. It is currently, however, an expensive option. Oceanographic noise may be reduced by the inclusion of appropriate direct local measurements and modeling.
Horizontal control Recent innovative approaches have greatly broadened the spatio-temporal spectrum of horizontal signals that can be observed. Measurements of changes in formation pressure (as a proxy for volumetric strain) in subseafloor IODP CORK observatories have been used for many years to detect transient deformation events (e.g., Davis et al., 2004, 2011), and have revealed the occurrence of near-trench slow slip events at subduction zones in Costa Rica and Nankai (Davis et al., 2015; Araki et al., 2017). The influence of oceanographic noise on borehole pressure measurements is easily removed using a seafloor reference pressure sensor at the wellhead, making downhole pressure sensing the lowest noise-level offshore geodetic technique currently available, although such observatories are expensive to install and have only been applied in a handful of locations. A fiber optic strain sensor continuously monitors the length of a fiber-optical cable stretched across the seafloor with laser interferometry (Zumberge et al, 2018). They can detect movements of a few microns over cable lengths up to several hundred meters. Its primary advantage is that it is isolated from seawater sound speed variations that impact acoustic ranging. Distributed acoustic sensing (DAS) is a new addition to the suite of cable measurement techniques. It also uses an optical fiber, typically a repurposed telecommunications cable, and is capable of detecting any perturbation that affects the optical path along the length of the fiber. It provides information with high spatial resolution (10s of meters) along the fiber in a frequency range that spans both seismic and geodetic processes (e.g. Jousset et al., 2018).
Figure 1: Schematic spatiotemporal representation of existing seafloor geodetic techniques and their ability to resolve 1-cm scale displacements in the (left) horizontal and, (right) vertical. Rectangular boxes represent measurement methods and rounded boxes with italic text show detectable Earth deformation processes. Direct- and Indirect Path Acoustic measurements (DPA, IPA) are abbreviated. Thicker borders highlight the techniques included in the Instrument Pool. Updated following Bürgmann and Chadwell (2014).
The two most mature techniques for horizontal control are direct path acoustic ranging and GNSS-Acoustic (GNSS-A) positioning. The direct path acoustic technique uses time of flight measurements between fixed monuments on the seafloor to infer baseline lengths and changes. This type of deployment has been employed in a wide range of settings where the strain rates are high enough to provide a detectable signal over the limited baseline lengths (~1 km) it supports (Peterson et al., 2019); e.g. transform faults (McGuire and Collins 2013), volcanic edifice (Brooks et al., 2009; Urlaub et al., 2018) and subduction zones (Osada et al., 2012). Indirect path ranging uses an intermediate interrogator, typically floating above the seafloor to enable longer baseline ranges. This technique has been successfully demonstrated (e.g. Blum et al., 2010; Sweeney et al., 2005) but is perhaps the best approach in only limited cases. GNSS-Acoustic deployments provide more flexibility in terms of their target signals and locations at the cost of increased complexity in terms of data acquisition and processing. Pioneered by Fred Spiess (Spiess 1985; Spiess et al. 1998) and championed for more than two decades by David Chadwell (e.g. 1997; 2008; 2010), this technique has contributed some of the most notable observational data sets highlighting the crucial role for seafloor geodetic measurements for constraining tectonic motions and the earthquake cycle (e.g., Gagnon et al., 2006; Sato et al., 2011; Iinuma et al., 2021). For the complementary nature of the sensors and the signals they can resolve, as well as the flexible range of targets on which they can be deployed, GNSS-Acoustic and absolute pressure gauges provide the best value initial investment for a community pool.
Figure 2: Schematic combined seafloor GNSS-Acoustic and on-land GNSS deployment in a subduction zone environment. Instrumentation insets include a [top left] Wave Glider configured with GNSS and solar power for communications (locomotion is driven by wave energy), and a [bottom left] seafloor transponder atop a reusable benchmark (pressure sensors are installed within transponder housing). Schematic modified from Newman (2011).
1.2 Instrument Pool:
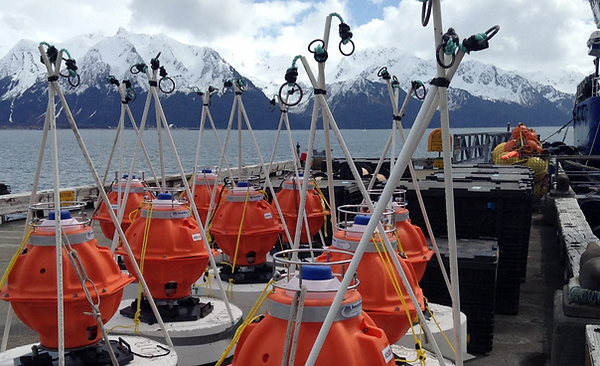
Born out of a proposal for facility infrastructure and seafloor geodetic instrumentation in 2019, the National Science Foundation supported the development and commissioning of an initial pool of seafloor geodetic tools to be used by the community. The initial instrument pool includes 51 acoustic transponders and seafloor reusable benchmarks, 17 bottom-pressure recorders (BPRs) housed within every third transponder, and three Wave Gliders (instrumentation shown Figure 2). With current methodologies for GNSS-Acoustic sites employing three transponders each, there are enough instruments for 17 unique sites measuring precision horizontal velocities to better than 5 mm/yr. These sites would each have one BPR capable of measuring vertical velocities in excess of 1 cm/mo. Each transponder is capable of operation to 3000 m depth and is outfitted with batteries rated for 10-year operation. For GNSS-Acoustic measurements, precise measurements are needed on a surface vehicle to simultaneously record precision GNSS signals from above satellites and transmit/receive acoustic signals below to accurately locate a site on the seafloor. This is done using the passively powered Wave Gliders which harvest differential vertical wave motion for propagation, and solar energy for electronics and communication.
1.3 First Community-wide Meeting:
Over the past several years, the geophysical research community has started to develop a much more substantial interest in seafloor geodesy, and interests in developing more capabilities within the US research community have become clearer. In the “Grand Challenges for Geodesy” it was noted that in order to address key questions about plate tectonic processes and the hazards they pose, it was necessary to improve and extend deformation observations offshore (Davis et al., 2012). In the “The Future of PBO in the GAGE Facility” report it was identified that extending geodetic observations offshore would help substantially in resolving problems in earthquake and tectonics research (Mattioli et al., 2014). Instrumental observations, primarily from campaign-mode seafloor geodesy was identified as a foundational capability that should be a included within a US geophysical facility as described in “Future Geophysical Facilities Required to Address Grand Challenges in the Earth Sciences” (Aster et al., 2015). The report from the first community workshop for SZ4D identified that there was “widespread recognition of the need to improve offshore observations, especially geodetic ones” (McGuire, et al., 2017). Most recently, in a workshop aimed at a reassessment of the Grand Challenges in Geodesy, a recommendation was made that seafloor geodetic measurements should be a prioritized recommendation for investment in geodesy (Freymueller et al., 2019). These prior meetings and reports not only helped mobilize the proposals for new community instruments and a facility (discussed above), but also the need for a dedicated community workshop for seafloor geodesy.
A meeting to organize and develop the seafloor geodetic community across the US was overdue, and following the funding of the initial instrument pool, such a meeting was necessary. A fraction of the original pool development team coordinated with UNAVCO and approached NSF and NASA to help support a meeting that would serve to move the community together on several goals. The workshop goals were:
-
Identify the active community, and their interest in performing experiments and working with seafloor geodesy data/equipment.
-
Get community input on interests in seafloor geodetic instrument pool usage, including about preferences for community-versus PI-led projects, and the levels of technical support, need for a facility, and data reduction PI or community users would like.
-
Evaluate possible targets for deployment of instruments within the community pool; particularly should community targets dominate plans for the current pool.
-
Seek feedback on inclusive and diverse workforce development to grow the community interested in ocean-going seafloor geodetic research.
-
Inform the community of the technologies and seek feedback on the instrument mix or technologies that should be considered for future development for seafloor geodesy. What are the opportunities that can spur innovation in seafloor geodesy?
The meeting was originally planned to be in-person in Summer 2020, but due to COVID-19, was transitioned to a virtual online platform in spring 2021 (April 6,7, 9). Because of the extended window before the workshop, we developed three pre-meeting webinars to help inform and prepare the community. These webinars were “The Current State-of-the-Art in Seafloor Geodesy” by R. Bürgmann (August 3, 2020), “Capabilities of the Upcoming Seafloor Geodetic Instrument Pool” with J. DeSanto (postdoctoral researchers), W. Chadwick, and D. Schmidt (August 13, 2020). In the fall 2020, the community was invited to submit White Papers that articulated a vision for what science could be accomplished with a seafloor geodetic capability, as well as how a future seafloor geodetic facility might operate. Two weeks before the community workshop, we held a final “White Paper Webinar” to present and discuss initial paper submissions (March 25, 2021). A website was developed to serve as a clearinghouse for information about the meeting, the instrument pool (below), and other activities related to the US seafloor geodetic community and instrumentation (https://www.seafloorgeodesy.org). The community workshop was held across 3 days (April 6-7th, and 9th) over a 4-hour period each day (1-5pm EDT). Because the meeting was virtual, a one-day break was included to allow for synthesis of information, including a detailed mid-meeting survey.
There were 165 individuals that registered for the meeting, with 97 from university and labs, 5 program officers, 9 IRIS and UNAVCO personnel, and 69 early-career scientists, postdocs (10) and students (27). Participants came from 20 countries (most from US, Canada, Chile, Germany and Japan), four US government agencies (USGS, NSF, NASA, NREL), and six industry groups. Basic information about the participants are available in Appendix 3.


2. Science and Hazards Applications
2.1 Science questions related to subduction zones, volcanoes, and transform faults
2.1.1 Subduction Processes
Two of the most pressing questions facing the scientific community working on subduction zones include: Where, when, and how do megathrust earthquakes occur? What is the relationship between transient slow slip processes and seismic slip? Detailed knowledge of frictional heterogeneity and its role in the resulting slip processes is also needed, particularly in relating slow slip and seismic slip. Seafloor geodesy is uniquely positioned to address these issues, as it promises to fill a major observational gap in our understanding of slip behavior on the offshore portions of subduction megathrusts. Furthermore, seafloor geodesy has been described as a “critical capability” that must be established for the proposed SZ4D initiative (McGuire et al., 2017). As offshore subduction megathrusts are also where the world’s largest tsunami waves are generated, addressing these issues has clear hazard and societal implications.
Though there are numerous issues in subduction science that can be addressed using seafloor geodetic methods, we focus here on the primary science issues discussed at the workshop that can be addressed with existing pool assets (17 GNSS-A arrays and 17 Absolute Pressure gauges). The state of interseismic slip deficits at most offshore megathrusts is currently unknown, and is a key parameter required to better understand where future megathrust ruptures may occur. GNSS-Acoustic methods are uniquely capable of revealing the distribution the offshore slip deficit along megathrusts, often interpreted as elastic strain accumulation (Wang and Dixon, 2004; Gagnon et al., 2005; Yokota et al., 2016; Kimura et al., 2019), and there was strong interest among workshop participants in targeting a large component of the instrument pool at this scientifically and societally important issue. Resolving the physical processes behind transient slow slip events and their relationship to potentially damaging seismic events was also of great interest, and requires knowledge of the distribution and occurrence of such events on offshore megathrusts. Better resolution of near-trench episodic slow slip events can be achieved with the seafloor geodesy pool assets, by detecting continuously-recorded centimeter-level vertical seafloor deformation using absolute pressure gauges (APGs) (e.g., Ito et al., 2013; Wallace et al., 2016; Yohler et al., 2019), and by undertaking more frequent Wave glider surveys of GNSS-Acoustic arrays in regions of shallow slow slip (Yokota and Ishikawa, 2020).
Box 1: Global Seafloor Geodesy Experiments
Figure 3. The megathrust interface transitions between little and high coupling, likely driving earthquake potential (Left; Lay et al., 2012). Seafloor geodesy has been successful in showing pronounced coupling in the offshore environment (e.g. Right; example offshore Nankai from Yokota et al., 2016).
2.1.2 Volcanic Processes
Learning about active volcanic processes is maximized by long-term geodetic monitoring that can capture dynamic processes of interest (Dvorak and Dzurisin, 1997; Dzurisin, 2003). On the seafloor, this could include seafloor spreading processes at mid-ocean ridges, magma movements at active seamounts, and in both settings, diking, faulting, and eruption-related deformation. Geodesy can help address important science questions such as: the relative roles of diking and faulting in plate boundary extension (Carbotte et al., 2006; Nooner et al., 2014), determining the width of the zone where extensional strain is accommodated and the implications for the rheology of the ocean crust and upper mantle (Chadwell and Spiess, 2008), the rates of magma accumulation and the geometry of magma storage zones beneath ridges and seamounts (Nooner and Chadwick, 2016), and how the temporal and spatial variations observed in seismicity are linked to magma movements in active volcanic settings (Wilcock et al., 2016; Chadwick et al., 2016). At actively deforming submarine volcanoes, seafloor geodetic observations can also be used to differentiate between magmatic-source models, if they have distinctive differences in their predicted vertical and horizontal displacement fields. On the submarine flanks of volcanic islands like Hawaii the deformation of the seafloor can reveal processes related to rift-zone spreading, seismogenic fault slip on decollement faults at the base of the volcano, and the long-term process of volcano growth (Phillips et al., 2008).
During the workshop, it was noted that sites that include monitoring multiple types of geophysical observables (e.g. seismicity and deformation) provide much more information for interpreting active volcanic processes than sites with more limited observations. For example, at intermediate and fast spreading ridges only a small percentage of the extension is accommodated seismically. Geodesy can confirm major subsurface magma movements such as inflation/deflation from magma accumulation or withdrawal, extension from dike intrusion and faulting, and can quantify magma volumes and supply rates from modeling. On-land monitoring provides critical information at volcanic islands, but also misses important details of the process located offshore and can only weakly constrain models without seafloor geodetic observations. Thus, there may be “more bang for the buck” in adding seafloor geodesy capabilities in places that are already instrumented in other ways.
Box 2: New Zealand
2.1.3 Transform Processes
The unique conditions of transform boundaries, particularly those offshore, provide clues about the general processes and properties that control the slip modes of individual faults, how slip events are initiated, and the degree to which behaviors are cyclic and stationary. For example, seismic moment release on oceanic transforms accommodates only ~15% of tectonic motions, which is a much lower fraction than on continental transform faults (Abercrombie and Ekstrom, 2001). Some evidence indicates aseismic slip accommodates significant fractions of
tectonic deformation, but whether this occurs as steady creep or episodically is unknown other than indirectly on a few systems. Additionally, relative to their continental counterparts, oceanic transforms appear to have seismic event magnitudes that have lower upper limits and they evolve to become quite straight and very long in some cases. What do their uniquely narrow widths and shallow depths within oceanic crust tell us about the processes that produce these similarities and differences with continental transforms and fault slip generally?
Owing to their location generally far offshore and distant from populations and infrastructure, seismic activity on most oceanic transform faults typically does not present much or any direct hazard. However, where they lie in close proximity to other near-shore plate boundaries, oceanic transform fault systems form key components of the slip partitioning processes in such regions, which in turn must be accounted for in both earthquake and tsunami hazard assessments. In some instances, oceanic transform fault earthquakes themselves may generate tsunamis (e.g. the 2018 magnitude 7.5 Palu earthquake created high local tsunami waves, Socquet et al., 2019; Miller, 1960; Brothers et al., 2020).
2.2 Hazards
In addition to the scientific rationale for seafloor geodesy in studies of offshore fault and volcanic deformation, these observations can serve to characterize hazards and thus to mitigate associated risks. Measurement techniques range from some that are reasonably mature (e.g., GNSS-A and ocean bottom pressure sensors) to those that are still evolving (e.g., optical fiber strain and cabled multi-system observatories). So, we divide the contributions of seafloor geodesy to hazard characterization and to risk mitigation into two categories as follows: First, those that can be immediately envisioned as possible with present technologies, and second, what we speculate will be possible in the near future. Similarly, we can divide the employment of these systems into long-term hazard characterization of active faults and volcanoes, short-term operational forecasting, and real-time early warning systems of tsunami and earthquake shaking.
2.2.1 What is possible today with seafloor geodesy
Perhaps the most obvious and immediate contribution to hazard characterization is that of measuring the state of interseismic coupling of offshore faults to identify potential rupture asperities. Knowledge of the rate at which a slip deficit is accumulating (often referred to as “coupling”) is a first-order constraint for any hazard calculation, though interpretation of whether such could be loading shallow faults or merely the result of analastic upper-plate deformation remains open (Wang and Dixon, 2004; Lay and Schwartz, 2004). This is particularly relevant for subduction megathrusts, where land-based observations are essentially blind to the degree of coupling near the trench (e.g., Loveless and Meade, 2011; Schmalzle et al., 2014; Figure 3), which is important for assessing tsunami potential. GNSS-A, and to a lesser degree absolute pressure measurements, can be used as direct inputs using traditional tectonic geodesy techniques such as block models (e.g., Loveless & Meade, 2011; Schmalzle et al., 2014; Evans et al., 2015; Kimura et al., 2019) and distributed slip inversions (e.g., Suwa et al., 2006; Chlieh et al., 2008; Yokota et al., 2016). However, stress shadows limit interseismic slip in areas updip of large locked asperities, irrespective of the seismic or aseismic slip behavior of the shallow megathrust (Lindsey et al., 2021).
Coupling estimates are used directly in both seismic and tsunami hazard assessments. Slip rate deficits are used to determine the “moment rates” of faults which, in a probabilistic framework, govern how likely earthquakes of different magnitudes are. Combined with a suitable ground motion model, this yields estimates of shaking intensities at return periods of interest (Field et al., 2014, 2015 ). In much the same way, coupling is a primary input into probabilistic tsunami hazard assessments (Grezio et al., 2017), where it is combined directly with forward tsunami propagation models to estimate coastal amplitudes at return periods of interest. Perhaps here, detailed imaging of heterogeneous coupling stands to make the largest impact. It has been shown that locking estimates can guide the generation of stochastic earthquake ruptures which can be combined with non-linear numerical models of tsunami propagation in an efficient way (Davies & Griffin, 2019; Small & Melgar, 2021). In other words, understanding offshore coupling with a high-level of detail can make it useful for refined tsunami hazards models.
A range of geophysical observations have revealed that seismic coupling and fault slip are inherently time-dependent over a wide range of time scales, including the generation of discrete slow slip events (e.g., Bürgmann, 2018 and references therein). Slow slip transients are relevant for earthquake hazard, as they can temporarily raise the probability of nearby large earthquakes (e.g., Mazzotti and Adams, 2004; Wallace et al., 2018) and may be involved in the nucleation process of great earthquakes (e.g., Kato et al., 2012; Ruiz et al., 2014). Seafloor geodetic observations can detect slow slip events far from land (e.g.; Araki et al., 2017; Yokota and Ishikawa, 2020) helping to illuminate the dynamic processes of offshore subduction and transform fault systems and their associated hazards.
Figure 4. Maps of estimated time advancement of earthquake (left, in seconds) and tsunami (right in minutes) wave detection and early warning thanks to the cabled seafloor observation network along the Japan trench (S-net, small red circles off NE Japan) and Dense Ocean floor Network system for Earthquakes and Tsunamis (DONET, small red circles off SW Japan). The labeled blue contours indicate the time advance over warnings from only land observations, if an earthquake occurred in a given location in the offshore area (after Aoi et al., 2020).
Finally, there are critical unanswered questions about shallow highly-tsunamigenic slip during large earthquakes. It is clear that some portion of the most shallow megathrust near the trench can slip seismically in large (M7+) earthquakes (Polet and Kanamori, 2000; Lay et al. 2012). For tsunami hazards this is particularly important because the shallow slip leads to large deformation of the seafloor and consequently to very hazardous tsunamis. However whether slip nucleates within this portion of the fault, or whether it is dynamically triggered by deeper slip is unknown. “Tsunami earthquakes”, events that produce a tsunami much larger than what is expected for their magnitude (Kanamori & Kikuchi, 1993), are suspected to nucleate and slip wholly within this domain. The most poignant example is the 2010 M7.8 Mentawai earthquake in Indonesia, which led to hundreds of casualties and which is interpreted to have up to 30m of slip on the upper ~6 km of the fault (Newman et al., 2011; Hill et al., 2012, Yue et al., 2014). What is the relationship between this catastrophic shallow slip and the interseismic coupling? Are tsunami earthquakes only possible in portions of the shallow megathrust with a high degree of coupling? Or, are they possible anywhere where there is non-zero coupling given enough time for a significant slip deficit to accumulate? From a hazards perspective these questions are fundamental because tsunami earthquakes are challenging to identify in real-time (e.g. Newman et al., 2011). They produce very weak shaking and can be perceived as not very hazardous in the moments after they originate. For example, for the M7.8 Mentawai earthquake the shaking measured by regional strong motion sensors was more akin to that of an M6 earthquake while the tsunami was locally as large as that from an M9 earthquake (Sahakian et al., 2019).
Given this, it is important to understand whether source areas for tsunamigenic shallow slip can be identified a priori. One potential avenue for this is to visit areas of known tsunami earthquakes, such as the 1896 Meiji, the 2010 Mentawai, the 1946 Aleutian Islands, or 1992 Nicaragua earthquakes, and survey them with GNSS-A. The pattern of coupling today can be used to narrow down the interseismic behavior of these portions of megathrusts. Of course, shallow slip occurs during other events that cannot be characterized as tsunami earthquakes. A somewhat recent example is the 2015 M8.3 Illapel earthquake in Chile which produced a 15m tsunami (Melgar et al., 2016). While this event was observed well by both onshore and offshore geophysical networks there is still uncertainty as to whether slip extends all the way to the trench or stops short of it (Satake & Heidarzadeh, 2017). As in the tsunami earthquake case, identifying the details of shallow slip is fundamental to long term tsunami hazard characterization. Resolving the remaining ambiguities will likely require imaging the rupture process with dense networks of seafloor seismic and geodetic sensors.
What will we be able to do with new technologies?
Beyond understanding the physical connection between interseismic processes, the coseismic rupture, and the resulting hazards, there also remain pressing issues of real-time characterization and warning. Densifying traditional offshore inertial instrumentation (broadband and strong motion) will provide incremental improvements to operational earthquake early warning (EEW). The hypocenters of many damaging earthquakes are offshore, so sensors closer to these regions can speed up the initial detection and characterization. However, algorithms that rely on these data will be faced with the same challenges that exist onshore. Chief among them is magnitude saturation, where large and very large events look alike and cannot be distinguished from each other. For example, the 2011 magnitude 9 Tohoku-oki earthquake was mischaracterized as magnitude 7.9 in real-time (Hoshiba & Ozaki, 2014). In the U.S. ShakeAlert EEW system, this difficulty is overcome by incorporating real-time GNSS (Murray et al., 2018) and specifically by employing the peak ground displacement (PGD) magnitude algorithm (Crowell et al., 2016). There is potential for an analogous solution offshore. High-sample rate (>1sps) absolute pressure could potentially be used to extract vertical coseismic displacements and could be employed in a similar way as real-time GNSS is used onshore. There are science challenges that need to be addressed here; for example, pressure records contain several geophysical signals in addition to those from displacements (acoustics, tsunami, etc). However there has been progress in this area (e.g. Kubota et al., 2021) and it is possible A-0-A sensor could contribute in this way. Additionally, on-shore Barbour & Crowell (2017) have identified an approach for using peak strain to obtain unsaturated magnitudes, here too there is potential for offshore strain measurements from point sensors or from DAS to also contribute to operational EEW.
Magnitude saturation also poses a challenge for tsunami early warning (TEW). If the earthquake is mischaracterized, any warning algorithm that relies on this information as input will yield an erroneous forecast of tsunami amplitudes. This was also seen in the 2011 M9 Tohoku-oki event (Hoshiba & Ozaki, 2014, Uchida and Bürgmann, 2021). As a result, the onshore EEW improvements using geodesy are also impacting TEW. This can be seen in the ongoing adoption by the NOAA tsunami warning centers of this technology (Williamson et al., 2020). Moreover, magnitude alone is not always a good proxy for tsunami hazards, we have seen this in the tsunami earthquake case above. There can be other complexities to earthquake source processes that alter the tsunami, for example, splay faults can increase the amplitude of the waves (Gao et al., 2018). Furthermore, there can be non-earthquake tsunami sources that can have catastrophic effects. Subaerial landslides can trigger very large local tsunamis, most recently in 2017 in Greenland (Paris et al., 2019) and in 2018 on Anak Krakatoa in Indonesia (Heidarzadeh, et al., 2020). Here, seafloor sensors are the best solution for warning. Tsunamis signals recorded by absolute pressure gauges or by strainmeters can be used to invert for the tsunami source and then to forecast their amplitudes to shore (e.g. Mulia & Satake, 2021). The great advantage of these approaches is that they do not require any knowledge or modeling pre-conceptions of what process is causing the tsunami. Rather, the data are simply inverted for an initial sea-surface disturbance. This approach can be used for tsunamis of seismogenic origin too. This more direct approach to warning is more robust than that which relies on on-shore proxies, however some difficulties beyond the availability of enough seafloor sensors remain. Specifically, for earthquake-triggered tsunamis, since tsunamis are gravity waves that propagate relatively slowly (compared to elastic waves), it takes a few minutes after the initial sea-surface disturbance is set up for the wave to relax away from its source region and for it to be discernible in seafloor sensors. So, while offshore instrumentation can be far superior for accurate forecasting, it is likely that a hybrid system that still relies on onshore data for the first characterizations remains the norm for some time to come.


.png)
Global Seafloor Geodetic measurements including prior, ongoing, and planned near-term sites. These include operations (going from North to South): The eastern Aleutians GNSS-A has recently been deployed following the 2019 M7.8 earthquake (Chadwell et al., 2018); continued pressure monitoring along Axial Seamount (e.g. Nooner et al., 2016) numerous types of observations along Cascadia (GNSS-A: Spiess et al., 1998, Chadwell and Spiess, 2008, Chadwell et al., 2018; Farrugia et al., 2019; Pressure: Frederickson et al., 2019; a borehole “CORK” instrument which includes tilt and volumetric strain (McGuire et al., 2018); Optical Fiber: Bartlow and Zumburge -- planned; see Cascadia Box); direct-path acoustic measurements in the Mediterranean on the flank of Mt. Etna (Urlaub et al., 2018) and across the Northern Anatolian Transform fault (Sakic et al., 2016), too near Naples shallow water GNSS masts were first tested for horizontal and vertical deformation (Iannaccone et al., 2018); In Japan there are numerous instrumentation networks across both the Japan Trench and offshore Nankai, most dominantly GNSS-A and pressure across dense cabled arrays (see Japan Box), as well as CORK-based volumetric strain observations (Davis et al., 2013), and trench-crossing acoustic paths (Yamamoto et al., 2017); East of Taiwan, along the Okinawa Trough, GNSS-Acoustic has been ongoing (Chen et al., 2021); In the Santa Barbara Basin slope stability was assessed using direct acoustic path measurements (Blum et al., 2010); In Hawaii GNSS-Acoustic (e.g. Osada et al., 2003) and direct-path acoustics (Brooks et al., 2011) and pressure (Phillips et al., 2008); Offshore testing on on shallow-water a GNSS mast (Xie et al., 2019); Off of Guerrero Mexico, GNSS-Acoustic measurements are ongoing (Cruz-Atienza et al., 2018); Two CORK observatories offshore Nicoya, Costa Rica observe volumetric strain and seafloor pressure (Davis et al., 2015); Direct-path acoustic measurements have been made along the East-Pacific Rise (McGuire et al., 2013); GNSS-Acoustic in the near-trench region offshore Peru (Gagnon et al., 2005); A direct-path acoustic network has been established offshore Northern Chile (Hannemann et al., 2018); Along the Hikurangi margin of New Zealand volumetric strain is observed on CORKs (Wallace et al., 2019), bottom pressure is also observed, as well as GNSS-Acoustic observations (Woods et al..2020; See New Zealand Box).

Seafloor Geodesy Deployments at New Zealand’s Hikurangi subduction zone. Seafloor pressure and IODP observatory deployments at the northern and central HIkurangi margin are targeted at resolve shallow, near-trench slow slip event processes, while the GNSS-Acoustic sites at central and southern Hikurangi are targeted at resolving the degree of interseismic coupling near the trench.Yellow symbols are GNSS-A sites, gray symbols on land are onshore GNSS sites (part of the GeoNet network; www.geonet.org.nz), gray, white, and red symbols are previous (Wallace et al., 2016; Woods et al., 2020) and ongoing Bottom Pressure Recorder deployments. Two IODP CORK observatories (pink dots; Wallace et al., 2019) measure downhole changes in pressure/volumetric strain, temperature, and fluid flow/geochemistry, and two longer-term deployment (5-year) Bottom Pressure Recorders on the IODP CORK observatory transect. Figure courtesy of Laura Wallace.
3. Pool Utilization Strategies
3.1 Potential Targets
3.1.1 Subduction Processes
Numerous subduction settings were discussed as potential deployment targets for the seafloor geodetic instrument pool. Some ideal characteristics of potential subduction targets that were discussed included locations where there is heterogeneity in subduction slip behavior, such as spatial variations in interseismic coupling and slow slip events (SSE). If episodic slow slip events are a potential target for the pool, such deployments are likely to be more successful in areas where large, shallow SSEs are known to occur and will be resolvable with GNSS-A and APG data. Given the limited number of instruments available in the seafloor geodetic pool, the challenge will be to strike a balance between sufficiently dense coverage at individual targets to gain meaningful information regarding the spatial distribution of slip behavior vs. coverage of enough different subduction zones to get a good sampling of settings to address key science questions. There was much discussion of possible “campaign-mode” measurements of the GNSS-A transponder arrays by moving the arrays among a series of permanent benchmarks and surveying them with the Wave Glider, to try and maximize the spatial coverage with the small number of arrays (17) available in the pool. Such an undertaking would require a remotely operated vehicle (ROV) and additional ship time, and may be a viable approach for establishing the distribution of interseismic locking. However, it is clear that a larger number of seafloor geodetic instruments are required for the pool to address many key scientific questions adequately, and in a large enough sampling of settings.
Based on participant survey results on the last day of the workshop, Cascadia and Alaska were the two highest priority subduction zones for the initial deployment of pool assets, followed by New Zealand, Central America, and South America (in that order). Cascadia was considered high-priority due to the large uncertainties in the state of interseismic coupling on the offshore megathrust, and the implications of this for tsunami and seismic hazard in the U.S Pacific northwest region. It was widely agreed that high impact science outcomes with major hazard implications (at targets like the Cascadia subduction zone) will help to motivate additional investment in more instrumentation to expand the pool, enabling future deployments at subduction zones elsewhere. However, given the large number of potential locations and key questions in subduction science to be addressed by seafloor geodesy, a follow-up workshop focused on developing a consensus on the primary subduction targets for the seafloor geodetic instrument pool would be valuable. There is also a clear need to coordinate seafloor geodetic deployments utilizing the instrument pool with the rapidly emerging SZ4D initiative, to leverage additional experiments and data acquisition efforts (such as ocean-bottom seismometer (OBS) deployments, seismic imaging, and others) in target areas of mutual interest to SZ4D and the seafloor geodetic community. Such complementary datasets will maximize the scientific outcomes and value of any seafloor geodetic experiments (and vice versa), and will vastly improve the understanding of the relationship of megathrust slip processes to a range of tectonic phenomena.
3.1.2 Volcanic Processes
The discussion of potential targets to address high-priority science goals in volcanic process research included sites where poorly understood submarine processes could be illuminated by seafloor geodesy. As reflected by the white paper submissions and the on-line polls during the workshop, the leading candidates were the submarine flank of Kilauea volcano, Hawaii, and Axial Seamount on the Juan de Fuca Ridge (in that order). Both sites are very active with multiple recent intrusive/eruptive events, and are likely to produce deformation that is measurable by the pool instruments within a reasonable period of time. These sites are particularly appealing because they are located within existing monitoring networks and complementary datasets exist (such as the OOI-Cabled Observatory at Axial Seamount and USGS-HVO at Kilauea, and marine multichannel seismic datasets). A seafloor spreading center like the Juan de Fuca Ridge is another potential target, where the thin oceanic crust allows a clearer view of the interaction between tectonic and volcanic processes.
Like in the subduction processes breakout group (described below), there was some discussion that the strategy to deploy a group of GNSS-A sites with seafloor benchmarks to make the first measurements followed by recovery of the transponders so they can be used elsewhere, might make sense for some projects where the frequency of deformation events is unknown. After an event of interest occurs then the transponders would be re-deployed on the benchmarks to document post-event changes. As noted above, this would require the use of an ROV. Another unconventional strategy worth exploring is the idea of having one transponder on the seafloor interrogated by three wave gliders at the surface. This would increase the position errors, but could also increase the number of monitored points on the seafloor by 3, and so might be useful in areas where large displacements are expected ( >10’s of centimeters). It was also recognized that for many signals of interest in volcanic settings, APGs or direct-path acoustic ranging might be a better solution than GNSS-A because they provide continuous (or frequent) measurements to catch transient events of interest (intrusions/eruptions), and can more easily span high strain rate zones. Particularly in the case of APGs, it was noted that having many of these lower-cost sensors can provide better spatial coverage of complex deformation fields, or could be deployed quickly for rapid response to events of interest.
3.1.3 Transform Processes
Attributes of oceanic transforms make them well-suited as potential targets for seafloor geodesy. The rapid slip rates documented on some oceanic transforms means changes in slip behavior and multiple slip events can be documented in deployment durations of only a few years or so. Moreover, their geometry implies seafloor instruments can be sited very close to and straddling these faults. Two oceanic transform systems were noted in the workshop as ideal for using seafloor geodesy to address scientific and hazard questions, the Fairweather-Queen Charlotte and the Gofar and Discovery systems.
The Fairweather-Queen Charlotte system is one of the fastest strike-slip faults on Earth (average slip rate is 45-55 mm/yr), stretching 1200-km from onshore to offshore from the northern tip of the Cascadia subduction zone to the St. Elias collisional belt in Alaska and Canada. Historically it has generated numerous M>6 earthquakes, one of which produced a 30-m tsunami. It is almost purely strike-slip motion where plate motion models predict transpression highlights scientific and hazard questions about slip partitioning and plate fragmentation (Elliott and Freymueller, 2020; Gulick et al., 2007; Reece et al., 2013).
The Gofar and Discovery transforms slip at 140 mm/yr on average, punctuated by M6 earthquakes at a few locations every 5-6 years; an aseismic slip event appears to have preceded one of these in 2008 (McGuire, 2008; Liu et al., 2020). The relatively predictable behavior of these transform faults makes them ideal for a seafloor geodetic experiment about the interacting roles of aseismic and seismic slip events. Repeating and somewhat predictable magnitude 6 earthquakes at a few locations every 5-6 years provide a target for geodetic measurements. For example, GNSS-A deployed along one side of the transform might capture event propagation, or across the fault to examine temporal depth variations (Liu et al., 2020), though this would require nearly continuous measurement of a GNSS-A array with a dedicated Wave Glider. Alternatively, the deep narrow valleys of transform faults are amenable to interrogation with direct-path acoustic ranging methods (McGuire and Collins, 2013). The continuous measurements provided by such devices make them particularly well-suited to detecting transient deformation events on transform faults (Lange et al., 2019).
3.1.4 Plate Motions
While most plates are reasonably well sampled because significant continental bodies or islands away from dynamically deforming plate edges allow for terrestrial geodetic observations characteristic of the plate as a whole, there remain a few plates where land coverage is insufficient to sufficiently constrain modern plate motions. Examples include the Caribbean, Philippine Sea, Scotia, and Juan de Fuca plates. Additionally, in places like the Indian Ocean and possibly the Gulf of Alaska may have significant internal plate deformation due to long-range tectonic and more local thermal and loading stresses.
3.2.5 Pool Usage Strategies
In the Subduction Processes breakout group, there seemed to be a general preference for the instrument pool to be used in community experiments, since there are only enough transponder arrays for 2-3 experiments. However, it was also recognized that the community experiment model is currently in need of revision, as it puts the onus on a few PIs to use their time and energy acquiring data for the rest of the community. A better solution to this issue could be the establishment of a facility, which employs individuals who are specifically trained to operate the instruments and acquire the data for community experiments.
Box 3: Cascadia
In the Volcanic Processes breakout group, there was some discussion of whether volcano-focused projects would be better executed as a PI-driven or Community-driven operation. The consensus was that it depended on the scale of a given project. For example, at the scale of a single volcano, it’s not clear that there would be sufficient scope to support a community effort. On the other hand, a larger and more ambitious project like monitoring multiple segments of a mid-ocean ridge could potentially be a larger community project. In any case, there was consensus that projects should aim to be multi-disciplinary for maximum scientific benefit, combining geodesy with other fields like seismology, vent fluid chemistry, or physical oceanography, for example. The OOI Cabled Observatory is an example of a community project that includes geodetic components, but also many others, with all the data open to the community. This model has fostered a lot of interdisciplinary communication and collaboration.
At the workshop, we also learned that IFREMER in France has recently funded the creation of a new cabled observatory offshore the island of Mayotte where an extraordinary eruption has been going on since 2018. The observatory will include 8 GNSS-A instruments, an autonomous surface vehicle, and 10-15 APGs. US and other international contributions to this effort are welcome and encouraged. This and other similar efforts elsewhere, could serve as a potential template for ways in which modest contributions from a US instrument pool (once established and enlarged with additional instruments) could be leveraged as part of a larger collaboration/consortium to achieve more ambitious science goals than would be possible otherwise, and without committing all the pool resources to a single community project.


Seafloor Geodesy Deployments in Cascadia. Left panel: Current, former, and future planned GNSS-A sites (some co-located with other instruments; US locations from David Chadwell and David Schmidt, pers. comm.; Canadian site locations from https://data.oceannetworks.ca/ and described in Farrugia et al., 2019). The planned GNSS-A site north at 48.2°N, -127.2°W is nearly co-located with a former GNSS-A site. Most GNSS-A sites are fairly new and either have short (<5 years) time series, or have deployed transponders and benchmarks but have not yet been surveyed. Planned sites are those with expected transponder deployment within the next year or so. Most US territory Cascadia sites were established with NSF funding; 2 southern Cascadia sites were established with USGS funding.` Right panel: Current and former pressure sensors, from Fredrickson et al., 2019. A variety of pressure instruments exist in Cascadia, including 2 CORK observatories off Vancouver Island. However, none of the pressure instruments are self-calibrating and all are subject to drift, and therefore cannot be used to constrain fault coupling. Efforts to use pressure data in Cascadia to detect slow slip events have so far not been successful (Fredrickson et al., 2019).
Onshore GNSS data in Cascadia has been used to argue for the possible presence of an offshore slow slip region in addition to the main onshore ETS region (Bartlow, 2020). A deployment of two seafloor optical fiber strainmeters off the coast of Oregon is planned for 2022 to look for offshore slow slip, earthquakes, and tremor.
4. Workforce Development
A primary goal of a seafloor geodetic initiative should be to grow the research community with seafloor geodetic expertise and increase the participation of individuals from groups historically underrepresented in the geosciences. The seafloor geodetic community has traditionally been small, with few graduate students being trained in how to work with the data, instrument design, and at-sea operations. Greater engagement and collaboration on seafloor geodetic problems will drive innovation in the conceptual and technological development of instrumentation, novel deployment strategies, experimental design, and data analysis techniques. There are several barriers that have historically impeded the growth of the seafloor geodetic community, including high ship costs, limited access to engineering support, logistical hurdles, extended data collection times, and limited access to data. Additionally, few undergraduates are exposed to seafloor geodetic work through their undergraduate coursework, and are unaware of this opportunity as they explore graduate school options.
As the community grows, it is also an opportunistic time to diversify the workforce and increase the representation of minorities in the Earth sciences (Bernard and Cooperdeck, 2018). There are inherent barriers to participation by those from underrepresented groups. Research activities that involve field work may not be appealing, particularly if time at sea is intimidating or of extended duration. Other individuals may not feel that they have the necessary skills (technical, computational, or theoretical) to work on seafloor geodetic problems, nor have access to the engineering support or computational resources. While working at sea may be intimidating to some, all messaging should communicate how this work is done on sophisticated research vessels with abundant technology. Recruitment and educational discussions with individuals from underrepresented groups should utilize the best practices (including active engagement, importance of role models and mentoring, lowering financial barriers to participation; Mosher and Keane, 2021).
The lessons learned from other groups within the broader geodetic community can provide a roadmap on how emergent research communities can be nurtured. The InSAR community has experienced significant growth over the past two decades, which has largely been driven by access to a global data set from multiple satellite systems and open-source software to process them. The specialized attributes of synthetic aperture radar data represented a barrier to this growth. But broad interest in these data drove participation in training workshops and short courses, and forced instructors to re-envision how to tailor those workshops and short courses to best meet the needs of the community. The formation of a coordinating organization (i.e. WInSAR) was also integral in growing the community by disseminating information, coordinating between individual research groups, and engaging satellite agencies on behalf of the data users. These organizations also provided an on-ramp for young investigators by providing networking opportunities, information clearinghouses for data and software, and allowed for young investigators to self-identify with a community. While many of these insights are transferable, it is worth noting that the initial conditions are different between the early days of the InSAR community and seafloor geodetic community. In particular, the InSAR community already had an abundance of data from across the globe for researchers to access. In contrast, seafloor geodetic data remains limited in volume and geographic extent. In the InSAR case, the research community was provided satellite data by the satellite agencies, whereas the seafloor geodetic community will be actively involved in the actual collection of the data. These caveats suggest that we should not expect the seafloor geodetic community to grow at the high rate of the InSAR community.
The continued engagement between the research community, industry partners, funding agencies, and the public will be essential to grow and sustain the community with interests in seafloor geodesy. Experiments that utilize the instrument pool should attempt to engage the local communities where the experiments take place. This might include public lectures, an invitation for local community college students to join the cruises, or collaboration with local scientists, particularly if the experiment is in foreign waters. Researchers should be encouraged to work closely with industry partners, as these partnerships ensure that both the science benefits from the latest technology, and that the career pipeline is strengthened for recent graduates. An ongoing dialogue between the research community and funding agencies is critical to better understand their respective concerns and priorities, to optimize use of the instrument pool, and to ensure that resources are used efficiently.
Summary Recommendations for Workforce Development:
Data Access: To encourage the greatest engagement with seafloor geodetic data, particularly for young investigators, there should be an open data policy for data collected using instruments in the seafloor geodetic pool. The data should be properly archived so that it is findable, accessible, interoperable, and reusable (FAIR Data Principles). The archived data should be given DOIs to ensure credit is given to those that participated in the data collection, which is particularly useful for young investigators who have invested time in the data collection effort. Data products should be provided to the community with various levels of processing (both raw and processed data), which will allow more researchers to work with the data depending on their interests and skills.
Training: The development of regular training workshops and short courses will be critical for preparing graduate students and young investigators for the intricacies of seafloor geodetic data and operations. Practice data sets will be essential for participants to test software and become familiar with data files. Instructors should evaluate the optimal mix of virtual and in-person training that might best suit the community. Virtual training allows the greatest access, while in-person training is key to building community. These training cohorts play an important role in building the horizontal and vertical connectivity of the community. Some training sessions could be offered during a research cruise (during transit) so that participants get both theoretical training and practical exposure to field operations in one trip. The training sessions may need to be modular so that participants can choose the content most relevant to their needs and interests. An initial target audience will be those who already have terrestrial geodetic skills.
Undergraduate Engagement: To develop a pipeline of students, undergraduates need to be introduced to seafloor geodesy at an early stage. This can be accomplished by developing course modules through GETSI (Pratt-Sitaula et al., 2015) or other efforts that expose undergraduates to seafloor geodetic technologies and applications, with a particular focus on attracting students from under-represented groups. These teaching materials should showcase career opportunities and links with industry. A slide deck can also be prepared that allows instructors to easily insert content in existing courses. REU and other internship opportunities are also good opportunities to expose undergraduates to seafloor geodetic activities.
Diversity: Engagement to underrepresented groups should emphasize the career potential and industry links with seafloor geodesy. Additionally, it is important to acknowledge how indeigenous knowledge and other ways of learning are complementary to the scientific method and technological development, and be respectful of indigenous cultures while in the field. New experiments can ensure that students at minority-serving institutions have the opportunity to actively engage in seafloor geodetic activities through internships (e.g. REU) and participatory programs that partner with community colleges.
Coordination: The establishment of a steering committee in seafloor geodesy will help to guide the growth of the community and represent the interests of the community with funding agencies and stakeholders. Workforce development should be part of the mandate for the steering committee. The membership of the steering committee should include representation from early career individuals. To further engage the research community, the seafloor geodetic listserv and website should be actively managed and used.
Networking Opportunities: Regular science workshops, breakout sessions, or forums will help to sustain the intellectual growth of the community through networking opportunities. A discussion board or communications platform (e.g. Slack) will allow individual researchers to network and seek solutions.
5. Looking Forward
5.1.1 Industry Partner Developments:
Seafloor geodesy is dependent on industry for its role in developing and replicating new technology. Four companies presented at the workshop. Liquid Robotics Corp. has developed the Wave Glider, an unmanned surface vehicle (USV) that is powered by wave and solar energy. This system will be used within the instrument pool to support collection of cost-effective GNSS-A observations. Recent Wave Glider developments are focused on ease of operation and integration of sensing payloads. Modifications to the Wave Glider can now support a winched Conductivity, Temperature and Depth (CTD) sensor that can measure water column structure down to depths of 150 m. Sonardyne manufactures the Fetch seafloor acoustic transponder and sensor logging node and the acoustic module for the Wave Glider that will be used for GNSS-A observations within the instrument pool, as well as transponders that are used for horizontal acoustic ranging. The Fetch unit can support a variety of sensors including a bottom pressure recorder, a Pressure Inverted Echo Sounder (PIES), and an Ambient-Zero-Ambient (AZA) system, which is Sonardyne’s implementation of A-0-A calibrated pressure. The Fetch units enable data harvesting with an USV. Kongsberg also offers an A-0-A calibrated pressure sensor with internal logging that is integrated into a seafloor package that includes a cNODE acoustic transponder for efficient data harvesting. The package can optionally include an accelerometer. RBR offers a compact bottom pressure recorder, the APT sensor that combines acceleration, pressure and temperature into 6-cm-diameter cylindrical package that can be inserted vertically into sediments, and BPR|zero that includes A-0-A pressure sensor calibrations. Their systems include ROV exchangeable data and battery packs to facilitate data recovery and long-term deployments on the seafloor.
In addition to the four companies, there was a presentation from the Department of Energy National Renewable Energy Lab (NREL). In 2019, the DOE published a report “Powering the Blue Economy” which describes a yearlong fact-finding effort to explore the power requirements, options and opportunities in eight maritime markets. NREL has mostly focused on wave and tidal energy sources to date, but are creating case studies to link technologies to deep water applications, including tsunami warning systems. They are keen to understand the needs of the seafloor geodesy community.
5.1.2 Investigator Development Recommendations:
Several complementary techniques and synergistic approaches were highlighted in investigator presentations at the workshop. One focus area was the mitigation of ocean signals to better reveal slow-slip events (SSE). Matt Wei et al. explained how data from current meters colocated with bottom pressure sensors in CPIES instruments (Current, Pressure, Inverted Echo Sounder) provide insights on geostrophic flow on the seafloor. These can be used to reduce ocean noise in bottom pressure measurements, helping to reveal SSEs that might be otherwise obscured. They successfully demonstrated the technique using simulations based on data from a small pilot experiment offshore Cascadia and with a larger deployment in the Drake Passage.
Though GNSS is not typically a limiting error source in GNSS-A techniques, there are important advances in GNSS positioning of marine platforms that could aid seafloor geodesy techniques. Christopher Watson and others provided perspectives from satellite altimetry applications that have demanding requirements for GNSS accuracies in marine environments. The noise floor from the measurement of sea-surface height from GNPS is now at the 1-cm level, and advanced precise point positioning (PPP) techniques imply that high accuracies can be realized in remote ocean locations without the benefit of a nearby reference station.
John Collins briefly introduced the Ocean Bottom Seismometery Instrument Center (OBSIC) facility as a possible template for an NSF MGG geodetic facility and then discussed recent developments in underwater data telemetry. Underwater communication presents a challenge to seafloor geodesy. Typically supported through acoustic techniques for seafloor geodesy, data transfer via optical telemetry was demonstrated for seismic applications. The technique allows for high data transfer rates in low ambient light (deep ocean or at night) between nearby (< 100 m) underwater platforms and has been used in “data mules” retrieving observations from OBSs. The technique can also support accurate clock synchronization.
Brooks and others presented on the applications of seafloor geodesy to hazards, highlighting the clear benefits the tools have in the ability to assess offshore earthquake hazard, use for rapid-post event analysis. Work is needed to better develop rapid techniques for data transfer in or near real-time, which currently remain cost-prohibitive. This limits the application of seafloor geodesy in early warning, where short latencies are needed to trigger useful alerts, and is an area that is ripe for innovation as seafloor geodesy matures as a technique.
5.2 Synergies and Future Technical Needs
On the second day two groups met to discuss “Complementary techniques and expanded impact” and “Future technical need and goals”. There was some overlap between the discussions.
Box 4: Japan
The first group spent considerable time discussing the potential synergies with physical oceanographers. For seafloor pressure time series data used to search for slow-slip events, it is important to correct for oceanographic signals. Even after removing tides, the signals are typically many times larger than the geodetic signals of interest. Regional and global models of ocean circulation can be quite accurate, but do not capture all subsurface processes that affect bottom pressure. There may be opportunities to get more physical oceanographers involved because bottom pressure and related observations such as temperature collected for seafloor geodesy experiments may be helpful in developing better circulation models and processes such as coastal trapped waves and deep circulation. Satellite altimetry is rapidly improving, and multi-mission data are now routinely used to generate various gridded and along-track sea surface height products. Similar products, especially with better retention of barotropic signals, could prove important for correcting bottom pressure observations for oceanographic phenomena. Other proxies such as bottom temperature are also useful in some locations.
The potential role of physical oceanographic data and models in improving GNSS-A studies was similarly discussed. The Sonardyne FETCH transponder can be equipped with a current meter and/or PIES (pressure and inverted echo sounder) to constrain bottom conditions and vertical travel times through the water column. There was a discussion of the desirability of replacing the 3 transponder and 1 Wave Glider configuration of current GNSS observations with 1 transponder and 2 Wave Gliders circling the transponder across from each other so as to increase the number of sites and improve oceanographic corrections for internal waves. The acoustic travel time measurements from GNSS-A experiments may be of interest to physical oceanographers studying internal waves. Improvements are being made in determining sea surface elevations from GNSS and may contribute to more accurate vertical measurements with GNSS-A geodesy.
Suggestions emerging from discussions included:
-
A workshop on bottom pressure observations to bring together the physical oceanographic and marine geodetic communities.
-
A GNSS-A developmental experiment involving transponders, several wave gliders and complementary sensors such as CPIES to compare techniques.
-
The addition of absolute pressure gauges to the long duration (5-year) ocean bottom seismometers (OBS) envisioned for the SZ4D and Global Seismic Networks
-
Reaching out to NOAA and exploring synergies between the SZ4D numerical modeling Research Coordination Network (RCN) and the physical oceanographic modeling community
The second group noted the importance of oceanographic data and the need for improved data workflows (see Section 5.3 below) but then focused on observational technologies. In the short term, it is important to continue to develop techniques to correct pressure data for drift and test these in deep water. Repeat surveys with high resolution bathymetric systems on AUVs such as those developed by MBARI and JAMSTEC have a vertical resolution of centimeters and are an important tool for geodesy.
On a 5-year timescale the group envisioned a variety of developments, including CTD casts from Wave Gliders, better use of the OOI Cabled Array to support geodesy, improvements in onboard processing, data return through pop-ups as well as acoustic telemetry, DAS with a more stable laser source, enhanced collaboration with industry and the use of artificial intelligence to pilot wave gliders and improve data collection strategies.
On longer timescales, AUVs, gliders and wire crawlers may be useful for ocean profiling to improve oceanographic corrections to GNSS-A and pressure data, fiber optic sensors in commercial cables, 10-cm resolution bathymetry collected across active margins, the use of distributed thermal sensing, quantum optical gravimeters as complements to calibrated seafloor pressure, and geopotential measurements via gravitational redshift observations.
5.3 Data Standards
On the second day, a breakout group met to discuss “Data archiving, dissemination, sharing, and standards”. The group recognized that data products and formats will depend on the instrumentation and will vary from relatively simple (pressure data) to quite complex (GNSS-A). To enable sharing, it is essential that agreed-upon data formats are defined to avoid each group formatting data differently. Careful attention is necessary in collecting and preserving the right metadata so that data standards follow FAIR principles (Findability, Accessibility, Interoperability, and Reusability). Archiving must extend from raw data to enable reprocessing and high-level products to support cross-disciplinary groups. The roles of an organized structure for groups collecting and archiving data need to be defined. With GNSS-A in mind, the group envisioned the following workflow:
Level 0 (raw) data and metadata are archived by the facility
Level 1 (position) and level 2 (vectors) data are generated and archived by a facility
Level 3 (models) data are generated at researcher level
It will be important to retain information about uncertainties at each level so that they are propagated into the higher-level products. It was noted that GNSS-A data standards are still very immature because the community is still growing. Data products, including metadata, generated by researchers should be made publicly available, either immediately or following necessary delays to ensure accuracy of information or protect embargoed information in some instances. There also need to be short courses to teach the community how to work with the data and understand data products
The group also discussed whether data collected using the instrument pool should have a 1- to 2-year PI embargo and whether fully open data was beneficial to early career scientists. In particular, graduate students might benefit from additional time to work with data before it is publicly released. Overall, the participants suggested that embargoes may be a barrier to access that will hinder community growth.
The group made the following recommendations:
A Working Group with domain experts in each instrument type should be formed with responsibilities that will include defining metadata standards, data formats (a mix of established and new), and workflows to generate data products
Data policies need to be developed to address data access (open versus embargoed)
Data should be archived in dedicated data archives
5.4 Future Facility and Governance
One goal of the workshop was to seek community feedback on how the seafloor geodetic instrument pool should be utilized, both in terms of scientific targets and how the data should be collected. A series of polls were administered to help collect community feedback. The first poll was administered midway through the workshop, and the poll focused on idealized pool instrumentation, strategies for the current pool utilization and operations including targeting, and potential training activities (Mid-workshop Survey results Appendix 5). The summaries from the breakout groups were relayed with the results of the Mid-workshop survey. This information, gauging the thoughts of the community that participated, was used to help the final two discussion periods on Pool Utilization Strategies and Community Organization. These periods were used for large group discussion on a wide range of topics related to the instrument pool and its utilization. During this period there was not sufficient opportunity to form a consensus, but a range of opinions and viewpoints were shared. From these comments, the Mid-workshop survey, and a live-response poll on Friday, meeting organizers compiled information into a Post-meeting survey that aimed to determine if there was general agreement on the main topics. This final poll represents our most-involved direct determination of the perceived functionality and value of the Instrument pool, its governance, and the workshop in general.
5.4.1 Pool Utilization
Community Experiments and PI-driven pool
Given the size of the current pool, participants strongly preferred one or two community experiments over individual PI-driven projects (Figure 5). Such experiments will have the broadest opportunities for scientific research and education throughout the community, but will task a smaller team with a greater burden of experiment operation. Community experiment would likely garner most scientific interest in the most favored target areas described above, including Cascadia, Alaska, or Hawaii. Whether instrumentation is used in community or PI-driven experiments, it is important that the current pool be utilized as soon as possible, to maximize the benefit of existing equipment which will otherwise age in a warehouse.
Preferred pool size/equipment
There was a general consensus at the meeting that the current instrumentation in the pool (sufficient for 17 GNSS-A sites) is grossly insufficient to meet the scientific needs of the community. Rather, roughly 50 GNSS-A/BPR sites are needed to establish a capability within the community to allow for multiple projects that span geographic and scientific targets. These would include a mix of sites rated to 6000 m depth (an increase from 3000m), stand-alone pressure gauges, and about 8-10 wave gliders (an increase from 3). The Post-meeting Survey showed extremely strong support for this size and instrument balance.
Given the current instrument pool size (17 sites), the community settled on a model where a majority of the pool transponders should be deployed along a subduction megathrust like Cascadia or Alaska. There was additional support for a subset of stations going to a subsea volcano, such as Kilaeua, but there was no consensus on a target (nor on an exact division of pool assets between subduction and volcano targets). There was support for retaining some instrumentation for rapid deployments during an emergent event such as a volcanic crisis or following a large earthquake. A focused, shorter workshop should be held to allow the community to finalize decisions about which experiments will be undertaken first with the pool assets.
Figure 5. Mid-workshop results for community interest in the prioritized use of the current instrument pool.
Community Organization
Through discussion at the meeting, and supported strongly during the post-meeting survey, there is community interest in establishing a Steering Committee (SC) with the primary responsibilities of organizing the community, providing coordination between groups, developing FAIR data standards, enabling workforce development, and ensuring data access. The steering committee would support the community through organizing training events and online materials, seek to develop an equitable workforce, promote the development of community experiments, and seek funding for the above activities. The SC could too serve to seek funds and help organize the governance structure of a new seafloor geodetic facility (below). The SC will also be responsible for defining its mission, vision and goals, reflecting community interests. The mechanism for the development of the SC is yet to be defined. One likely mechanism is the development of a diverse Nominating Committee with individuals from academic institutions and government, and other research institutions to fill the initial SC, with regular transition of individuals, possibly on 3-year terms.
Seafloor Geodetic Facility
There is substantial support from those attending the workshop for a facility to manage instrumentation and operations for the US Pool (Figure 6, Post-Meeting Survey Appendix 5). The Facility would support the operations, maintenance, deployment and recovery of instrumentation on PI-dirven and community projects. There is a perception that maintaining these actions within such a facility will ensure higher-data quality and recovery, as well as improve systems’ utilization and longevity. The facility could maintain a marine test-bed for testing and calibration of existing equipment, as well as testing new and accompanying technologies. Because of the expense of seagoing equipment and research, maintaining a facility may be most practical.
Figure 6: Post-workshop result for Interest in the development of a facility for seafloor geodesy instrumentation and operations.
Questions remain about the best method to proceed in facility development. Included with White Papers (Appendix 4) is a report initially submitted to the NSF stating the potential benefits of having such a seafloor facility as part of the combined Future Geophysical Facility (FGF), now planned for competition in 2025. Inclusion within the FGF will leverage existing strengths in engineering, data archiving, scientist training, outreach and governance and would enable broader participation and access for geodetic data that spans the coastline, such as needed when working in subduction zone environments. If a seafloor geodetic facility were to remain separate from the FGF, then it may be beneficial to combine it with OBSIC in a combined seafloor geophysical pool, potentially relying on the FGF for some aspects of operation, including data archiving, and training. Certainly with either of these potential combinations, a significant effort is necessary to ensure capabilities are developed for maintenance, and modernization of the seafloor geodetic instrumentation. These capabilities do not currently reside within IRIS nor UNAVCO, or Woods Hole Oceanographic institution, which manages OBSIC.


Seafloor Geodesy Deployments in Japan. (a) GNSS-A sites along the Japan trench from Honsho et al., 2019. These sites recorded co- and post-seismic deformation following the 2011 MW 9.0 Tohoku-oki earthquake. (b) Onshore GNSS and offshore GNSS-A velocities along the Nankai subduction zone in southern Japan from Kimura et al. (2019). (c) and (d) locations of the DONET, DONET2, and S-NET cabled ocean bottom observation networks from Aoi et al. (2020). These networks include seismic instrumentation as well as seafloor pressure instruments usable for geodetic applications.
6. Summary Recommendations
Community and Organization:
-
Seafloor geodesy is critical to improving our understanding of offshore plate boundary processes and hazards (i.e. subduction zones, transform faults, and ridges), as well as constraining the deformation of subsea volcanoes.
-
The formation of a seafloor geodetic facility is necessary to support the operations, maintenance, deployment, and recovery of instrumentation on PI-dirven and community projects.
-
The establishment of a steering committee for seafloor geodesy will help to guide the development of a facility, training, data standards, community engagement, and communications with funding agencies and stakeholders.
-
Seafloor geodetic data should be readily accessible and follow FAIR principles. Greater data access will increase participation from young investigators. Data products should be provided to the community with various levels of processing (both raw and processed data). Standardized data and metadata formats are needed.
-
Thoughtful usage of the current seafloor geodetic instrument pool provides opportunities to develop an active and participating community through conscientious and equitable workforce development, including groups under- represented in earth sciences. Strong community participation will drive innovation in seafloor geodetic technologies and techniques.
-
New collaborations with the oceanography community will provide opportunities for reducing noise sources and for providing new constraints that are beneficial to both disciplines.
Instrument Pool:
-
Community experiments are favored for the majority of the current pool. Such experiments are best conducted by (facility) staff who are adequately trained, can maintain the equipment, and can collect the data with consistent standards. Community participation will be important for training and workforce development. Smaller projects (using limited instrumentation) may be better conducted by PI-led efforts.
-
The current pool could support up to two community experiments, There was strong interest in using the pool to establish for 8-12 sites in a subduction megathrust like Cascadia; with support too for 4-8 sites at a subsea volcano, such as Kilaeua.
-
The instrument pool will need to grow to meet the community needs. Coordination with international partners may be a mechanism to leverage limited resources and achieve more science goals. The current pool is only sufficient for 2-3 focus areas.
-
Cascadia and Alaska were the highest priority subduction zones for the initial deployment of instrument pool assets, followed by New Zealand, Central America, and South America (in that order).
-
Leading candidates for which subsea volcanism include the flank of Kilauea and Axial Seamount (in that order). In some cases, absolute pressure gauges, direct-path acoustic ranging might be a better instrumental solution than GNSS-A.
-
Two oceanic transforms were identified for using seafloor geodesy to address scientific and hazard questions; Fairweather-Queen Charlotte, and Gofar and Discovery systems.
Instrumentation:
-
Absolute pressure gauges (APG) provide the most mature technology for vertical deformation of the seafloor. Gravity and tiltmeters provide additional constraints.
-
GNSS-A and direct path acoustics are the most mature technologies for horizontal observations. Fiber optic strainmeters and DAS show promise, but need further development.
-
A subsea test-bed is necessary to facilitate instrument development and to benchmark and calibrate new technologies.

Contributors
Organizing Committee
Andrew Newman (Chair)
Georgia Institute of Technology
Noel Bartlow
University of Kansas
Benjamin Brooks
US Geological Survey - Earthquake Science Center
Donna Charlevoix
UNAVCO
Bruce Haines
NASA Jet Propulsion Laboratory - California Institute of Technology
David Schmidt
University of Washington
Workshop Program Committee
James Foster (Chair)
University of Stuttgart Institute of Geodesy
Bruce Haines
NASA Jet Propulsion Laboratory - California Institute of Technology
Yoshihiro Ito
Disaster Prevention Research Institute - Kyoto University
Laura Wallace
University of Texas Institute of Geophysics and GNS Science, New Zealand
Janet Watt
USGS - Pacific Coastal Marine Science Center
Mark Zumberge
Scripps Institution of Oceanography
Writing Committee
Andrew Newman (Chair)
Georgia Institute of Technology
James Foster
University of Stuttgart Institute of Geodesy
Eiichiro Araki
JAMSTEC
Noel Bartlow
University of Kansas
Roland Bürgmann
University of California, Berkeley
William Chadwick
Oregon State University, Hatfield Marine Science Center
Donna Charlevoix
UNAVCO
Joan Gomberg
US Geological Survey - Seattle
Bruce Haines
NASA Jet Propulsion Laboratory - California Institute of Technology
Diego Melgar
University of Oregon
David Schmidt
University of Washington
Laura Wallace
University of Texas at Austin
Meng (Matt) Wei
University of Rhode Island
William Wilcock
University of Washington
Appendices
Appendix 1: Acronyms, Abbreviations, and other common jargon within (seafloor) geodesy
Below is a growing list of terms frequently used within geodesy and sea-going geophysical research communities. As part of an attempt to democratize the science of the field, we are including them here for easy look-up. Too, if there's something that you find missing and would like to have included, please make a recommendation.
Appendix 2: Meeting Agenda
TUESDAY, APRIL 6
Introduction and Instrument pool (Presentations)
-
Instrument Pool [Newman] - 10 min.
-
A GNSS-Acoustic Survey Design Primer [DeSanto] - 10 min.
-
Seafloor pressure geodesy: challenges and opportunities [Frederickson] - 10 min.
-
Seafloor Geodesy Instrument Pool Commissioning [Zumberg] - 10 min.
Experiments and Previous Lessons Learned (Presentations)
-
Seafloor Geodesy on the Cascadia Subduction Zone [Schmidt] - 15 min.
-
Observations of tectonic strain accumulation and earthquake caused displacement near the trench of the Aleutian Subduction Zone [Webb] - 15 min
-
Seafloor cabled tilt and strain observatories capturing shallow slow slip events in the Nankai Trough, Japan [Araki]- 15 min.
-
Seafloor geodetic investigations at the Hikurangi subduction zone offshore New Zealand [Wallace]- 15 min.
-
Measuring seafloor deformation and tectonic strain build-up with acoustic direct path ranging [Kopp]- 15 min.
-
A Brief History of Deformation Measurements at Axial Seamount [Nooner]- 15 min.
Commercial/Industry Capabilities and Developments (Presentations)
-
Sonardyne’s Seafloor Instruments – Overview & Update - Geraint West (Sonardyne) - 6 min.
-
Modular System for Seafloor Geodesy - Jake Sobin (Konsberg) - 6 min.
-
Wave Glider Applications in Seafloor Geodesy - Jimmy Board (Liquid Robotics Inc.) - 6 min.
-
RBRquartz - a family of bottom pressure recorders and accelerometers for seafloor geodesy - Greg Johnson (RBR) - 6 min.
-
Potential Collaborations for Providing Power to the Deep - Scott Jenne (NREL) - 6 min.
WEDNESDAY, APRIL 7
Seafloor geodesy science targets (Presentations)
-
Seafloor Geodesy Science Target: Megathrust processes [Bartlow] - 10 min.
-
Seafloor Geodesy Science Target: Volcanic Processes [Chadwick]- 10 min.
-
Earthquake rupture barrier and possible slip on East Pacific Rise transform faults [Liu]- 10 min.
-
Capacity & Community-Building in the Field of SAR: Recent Activities, Successes, Challenges, and Lessons Learned [Meyer]- 10 min.
Breakouts 1a-d: Science targets
-
Megathrust processes – Session Notes
-
Transform faults and rifting processes, plate kinematics – Session Notes
Complementary Techniques and Applications (Presentations)
-
Seafloor Geodesy: Hazards Applications and Research [Brooks] - 10 min.
-
Reduce ocean noise in seafloor pressure data based upon ocean geostrophic balance [Wei]- 10 min.
-
GNSS Positioning in the Marine Domain: Perspectives from the Altimeter Validation Community [Watson]- 10 min.
-
An OBSIC Perspective on Operating a Seafloor Geophysical Facility for NSF & OBS Data offload and in-situ clock calibration using optical telemetry [Collins]- 10 min.
Breakouts 2a-d: Complementary Techniques and Applications
-
Hazard applications and requirements – Session Notes
-
Future technical needs and goals – Session Notes
-
Data archiving, dissemination, sharing, and standards – Session Notes
-
Complementary techniques and expanded impact – Session Notes
FRIDAY, APRIL 9
Breakout Summaries (Presentations)
-
Welcome plan for the day [Foster] - 15 min.
-
Report out on Survey results [Newman] - 10 min.
-
Breakout Summaries [Session Leads] - 60 min
-
5 min each of 8 groups
-
20 min discussion
-
Community Discussion on Pool Utilization (Presentations)
-
Community vs. PI-driven proposals - 30 min - Session Notes
-
Live Poll - 5 min
-
Targets - 30 min
-
Live Poll - 5 min
Plenary Discussion and Draft Workshop Conclusions(Presentations)
-
Proposal opportunities (NSF/USGS around for comment?)
-
Workshop needs
-
Writing activities
Appendix 3: Participant List
-
157 participants attended at least one session
Appendix 4: White Papers [electronic]
Appendix 5: Poll Results [electronic]
References
-
Abercrombie, R.E. & G. Ekström (2001), Earthquake slip on oceanic transform faults, Nature, 410(6824), pp. 74-77.
-
Anderson G, Constable S, Staudigel H, Wyatt FK. (1997). A seafloor long-baseline tiltmeter. J. Geophys. Res. 102(B9):20269–85
-
Aoi, S., Asano, Y., Kunugi, T., Kimura, T., Uehira, K., Takahashi, N., ... & Fujiwara, H. (2020). MOWLAS: NIED observation network for earthquake, tsunami and volcano. Earth, Planets and Space, 72(1), 1-31.
-
Araki, E., D. M. Saffer, A. J. Kopf, L. M. Wallace, T. Kimura, Y. Machida, S. Ide, and E. Davis (2017), Recurring and triggered slow-slip events near the trench at the Nankai Trough subduction megathrust, Science, 356(6343), 1157.
-
Aster, R, M. Simons, R. Bürgmann, N. Gomez, W.C. Hammond, S. Holbrook, E. Chaussard, L. Stearns, G. Egbert, J. Hole, T. Lay, S. McNutt, M. Oskin, B. Schmandt, D. Schmidt, J. Vidale,
-
L. Wagner, and P. Winberry (2015). “Future geophysical facilities required to address grand challenges in the Earth sciences”, A Community report to the National Science Foundation, 47 pp.
-
Ballu, V., Ammann, J., Pot, O., De Viron, O., Sasagawa, G. S., Reverdin, G., ... & Diament, M. (2009). A seafloor experiment to monitor vertical deformation at the Lucky Strike volcano, Mid-Atlantic Ridge. Journal of Geodesy, 83(2), 147.
-
Barbour, A. J., & Crowell, B. W. (2017). Dynamic strains for earthquake source characterization. Seismological Research Letters, 88(2A), 354-370.
-
Bartlow, N. M. (2020). A long‐term view of episodic tremor and slip in Cascadia. Geophysical Research Letters, 47(3), e2019GL085303.
-
Bernard, R. E., and E. H. G. Cooperdeck (2018), No progress on diversity in 40 years, Nat. Geosci., 11, 292–295, https://doi.org/10.1038/s41561-018-0116-6.
-
Blum, J. A., Chadwell, C. D., Driscoll, N., Zumberge, M.A., (2010). Assessing slope stability in the Santa Barbara Basin,California, using seafloor geodesy and CHIRP seismic data. Geophys. Res. Lett. 37:L13308
-
Bürgmann, R., & Chadwell, D. (2014). Seafloor geodesy. Annual Review of Earth and Planetary Sciences, 42, 509-534.
-
Bürgmann, R. (2018). The geophysics, geology and mechanics of slow fault slip. Earth and Planetary Science Letters, 495, 112-134.
-
Brooks, B. A., J. Foster, J. McGuire, and M. Behn (2009), Submarine Landslides and Slow Earthquakes: Monitoring Motion with GPS and Seafloor Geodesy, in Encyclopedia of Complexity and System Science, edited by W. Lee, Springer.
-
Brothers, D.S., Miller, N.C., Barrie, J.V., Haeussler, P.J., Greene, H.G., Andrews, B.D., Zielke, O., Watt, J., & Dartnell, P. (2020), Plate boundary localization, slip-rates and rupture segmentation of the Queen Charlotte Fault based on submarine tectonic geomorphology, Earth and Planetary Science Letters, 530, 15 p.
-
Carbotte, S. M., R. S. Detrick, A. Harding, J. P. Canales, J. Babcock, G. Kent, E. van Ark, M. Nedimovic, and J. Diebold (2006), Rift topography linked to magmatism at the intermediate spreading Juan de Fuca Ridge, Geology, 34(3), 209-212
-
Chadwell, C., F. Spiess, J. Hildebrand, L. Young, G. Purcell Jr, and H. Dragert (1997), Sea Floor Strain Measurement Using GPS and Acoustics, in Gravity, Geoid and Marine Geodesy, edited, pp. 682-689, Springer.
-
Chadwell, C. D., and F. N. Spiess (2008), Plate motion at the ridge-transform boundary of the south Cleft Segment of the Juan de Fuca Ridge from GPS-Acoustic data, J. Geophys. Res., 113, B04415, doi:04410.01029/02007JB004936.
-
Chadwell, C. D., Schmidt, D. A., Webb, S. C., Nooner, S. L., Ericksen, T. L., Brooks, B. A., & Foster, J. H. (2018). Expansion of GPS-acoustic arrays offshore the Cascadia and Alaska subduction zones. In AGU Fall Meeting Abstracts (Vol. 2018, pp. T44C-02).
-
Chadwick, W. W., Jr., B. P. Paduan, D. A. Clague, B. M. Dreyer, S. G. Merle, A. M. Bobbitt, D. W. Caress, B. Philip, D. S. Kelley, and S. L. Nooner (2016), Voluminous eruption from a zoned magma body after an increase in supply rate at Axial Seamount, Geophys. Res. Lett., 43, 12063-12070, doi:10.1002/2016GL071327.
-
Chen H-Y, Ikuta R, Hsu Y-J, Tsujii T, Ando M, Tu Y, Kohmi T, Takemoto K, Mizuno K, Tung H, Ku C-S and Lin C-H (2021). A Decade of Global Navigation Satellite System/Acoustic Measurements of Back-Arc Spreading in the Southwestern Okinawa Trough. Front. Earth Sci. 9:601138. doi: 10.3389/feart.2021.601138
-
Chlieh, M., Avouac, J. P., Sieh, K., Natawidjaja, D. H., & Galetzka, J. (2008). Heterogeneous coupling of the Sumatran megathrust constrained by geodetic and paleogeodetic measurements, J. Geophys. Res., 113(B5).
-
Crowell, B. W., Schmidt, D. A., Bodin, P., Vidale, J. E., Gomberg, J., Renate Hartog, J., ... & Jamison, D. G. (2016). Demonstration of the Cascadia G‐FAST geodetic earthquake early warning system for the Nisqually, Washington, earthquake. Seismological Research Letters, 87(4), 930-943.
-
Cruz‐Atienza, V.M., Ito, Y., Kostoglodov, V., Hjörleifsdóttir, V., Iglesias, A., Tago, J., Calò, M., Real, J., Husker, A., Ide, S. and Nishimura, T. (2018). A seismogeodetic amphibious network in the Guerrero seismic gap, Mexico. Seismol. Res. Lett., 89(4), pp.1435-1449.
-
Davies, G., & Griffin, J. (2019). Sensitivity of probabilistic tsunami hazard assessment to far-field earthquake slip complexity and rigidity depth-dependence: Case study of Australia. Pure and Applied Geophysics, 1-28.
-
Davis E., Becker K., Dziak R., Cassidy J., Wang K., Lilley M. (2004), Hydrological response to a seafloor spreading episode on the Juan de Fuca ridge. Nature 430:335–38
-
Davis E., Heesemann M., Wang K. (2011), Evidence for episodic aseismic slip across the subduction seismogenic zone off Costa Rica: CORK borehole pressure observations at the subduction prism toe. Earth Planet. Sci. Lett. 306:299–305.
-
Davis, E., M. Kinoshita, K. Becker, K. Wang, Y. Asano, Y. Ito (2013), Episodic deformation and inferred slow slip at the Nankai subduction zone during the first decade of CORK borehole pressure and VLFE monitoring, Earth and Planetary Science Letters 368,110-118.
-
Davis, E. E., Villinger, H., & Sun, T. (2015). Slow and delayed deformation and uplift of the outermost subduction prism following ETS and seismogenic slip events beneath Nicoya Peninsula, Costa Rica. Earth and Planetary Science Letters, 410, 117–127. https://doi.org/10.1016/j.epsl.2014.11.015
-
Dvorak, J. J., and D. Dzurisin (1997), Volcano geodesy: The search for magma reservoirs and the formation of eruptive vents, Rev. Geophys., 35(3), 343-384, doi:10.1029/97RG00070.
-
Dzurisin, D. (2003), A comprehensive approach to monitoring volcano deformation as a window on the eruption cycle, Rev. Geophys., 41(1), 1001, doi:10.1029/2001RG000107.
-
Elliott, J. and Freymueller, J.T. (2020), Kinematics of the Fairweather-Queen Charlotte Transform System and Deformation of the Northeast Pacific Plate, AGU Fall Meeting, Abstract T050-09.
-
Evans, E. L., Loveless, J. P., & Meade, B. J. (2015). Total variation regularization of geodetically and geologically constrained block models for the Western United States. Geophysical Journal International, 202(2), 713–727.
-
Fabian M, Villinger H. (2008). Long-term tilt and acceleration data from the Logatchev hydrothermal vent field, Mid-Atlantic Ridge, measured by the Bremen Ocean Bottom Tiltmeter. Geochem. Geophys. Geosyst. 9:Q07016
-
Farrugia, J.J., Heesemann, M., Scherwath, M., Moran, K., Davis, E., Wang, K., Jiang, Y., Henton, J., Chadwell, D., Solomon, E. and Lauer, R. (2019), Northern Cascadia SubductioN Zone Observatory (NCSZO): an interdisciplinary research initiative to assess tsunami and earthquake hazard from the Cascadia megathrust. In OCEANS 2019 MTS/IEEE SEATTLE (pp. 1-8). IEEE.
-
Fox, C. G. (1993), Five years of ground deformation monitoring on Axial Seamount using a bottom pressure recorder, Geophys. Res. Lett., 20(17), 1859-1862, doi:10.1029/93gl01216.
-
Fredrickson, E. K., Wilcock, W. S., Schmidt, D. A., MacCready, P., Roland, E., Kurapov, A. L., ... & Sasagawa, G. S. (2019). Optimizing sensor configurations for the detection of slow‐slip earthquakes in seafloor pressure records, using the Cascadia Subduction Zone as a case study. Journal of Geophysical Research: Solid Earth, 124(12), 13504-13531.
-
Freymeuller, J. T., R. Bendick, A. Borsa, A. V. Newman [Eds.] (2019), "Measuring the Restless Earth: Grand Challenges in Geodesy", Report from the workshop "Revisiting Our Grand Challenges in Geodesy, Michigan State University.
-
Gagnon, K., C. D. Chadwell, and E. Norabuena (2005), Measuring the onset of locking in the Peru-Chile trench with GPS and acoustic measurements, Nature, 434(7030), 205-208,.doi: 10.1038/nature03412.
-
Gao, D., Wang, K., Insua, T. L., Sypus, M., Riedel, M., & Sun, T. (2018). Defining megathrust tsunami source scenarios for northernmost Cascadia. Natural Hazards, 94(1), 445-469.
-
Grezio, A., Babeyko, A., Baptista, M. A., Behrens, J., Costa, A., Davies, G., ... & Thio, H. K. (2017). Probabilistic tsunami hazard analysis: Multiple sources and global applications. Reviews of Geophysics, 55(4), 1158-1198.
-
Gulick, S.P., Lowe, L.A., Pavlis, T.L., Gardner, J.V. and Mayer, L.A. (2007), Geophysical insights into the Transition fault debate: Propagating strike slip in response to stalling Yakutat block subduction in the Gulf of Alaska, Geology, 35(8), pp.763-766.
-
Hannemann, K., Lange, D., Kopp, H., Petersen, F. and Contreras-Reyes, E., (2017). Deformation offshore Northern Chile monitored by a seafloor geodetic network (GeoSEA). In EGU General Assembly Conference Abstracts (p. 7833).
-
Heidarzadeh, M., Ishibe, T., Sandanbata, O., Muhari, A., & Wijanarto, A. B. (2020). Numerical modeling of the subaerial landslide source of the 22 December 2018 Anak Krakatoa volcanic tsunami, Indonesia. Ocean Engineering, 195, 106733.
-
Hill, E. M., Borrero, J. C., Huang, Z., Qiu, Q., Banerjee, P., Natawidjaja, D. H., et al. (2012). The 2010 Mw 7.8 Mentawai earthquake: Very shallow source of a rare tsunami earthquake determined from tsunami field survey and near‐field GPS data. Journal of Geophysical Research: Solid Earth, 117(B6).
-
Honsho, C., Kido, M., Tomita, F., & Uchida, N. (2019). Offshore postseismic deformation of the 2011 Tohoku earthquake revisited: Application of an improved GPS‐acoustic positioning method considering horizontal gradient of sound speed structure. Journal of Geophysical Research: Solid Earth, 124(6), 5990-6009.
-
Hoshiba, M., & Ozaki, T. (2014). Earthquake Early Warning and Tsunami Warning of the Japan Meteorological Agency, and Their Performance in the 2011 off the Pacific Coast of Tohoku Earthquake (MW9.0). In Early warning for geological disasters (pp. 1-28). Springer, Berlin, Heidelberg.
-
Iannaccone, G., Guardato, S., Donnarumma, G. P., Martino, P. D., Dolce, M., Macedonio, G., et al. (2018). Measurement of Seafloor Deformation in the Marine Sector of the Campi Flegrei Caldera (Italy). Journal of Geophysical Research: Solid Earth, 123(1), 66–83. https://doi.org/10.1002/2017jb014852
-
Iinuma, T., M. Kido, Y. Ohta, T. Fukuda, F. Tomita, and I. Ueki (2021), GNSS-Acoustic Observations of Seafloor Crustal Deformation Using a Wave Glider, Frontiers in Earth Science, 9, doi:10.3389/feart.2021.600946.
-
Ito, Y., Hino, R., Kido, M., Fujimoto, H., Osada, Y., Inazu, D., ... & Ashi, J. (2013). Episodic slow slip events in the Japan subduction zone before the 2011 Tohoku-Oki earthquake. Tectonophysics, 600, 14-26.
-
Jousset, P., T. Reinsch, T. Ryberg, H. Blanck, A. Clarke, R. Aghayev, G. P. Hersir, J. Henninges, M. Weber, and C. M. Krawczyk (2018), Dynamic strain determination using fibre-optic cables allows imaging of seismological and structural features, Nature Communications, 9(1), 2509, doi:10.1038/s41467-018-04860-y.
-
Kanamori, H., & Kikuchi, M. (1993). The 1992 Nicaragua earthquake: a slow tsunami earthquake associated with subducted sediments. Nature, 361(6414), 714-716.
-
Kato, A., K. Obara, T. Igarashi, H. Tsuruoka, S. Nakagawa, and N. Hirata (2012), Propagation of slow slip leading up to the 2011 Mw9.0 Tohoku-Oki earthquake, Science, 335(6069), doi:10.1126/science.1215141.
-
Kimura, H., Tadokoro, K., & Ito, T. (2019). Interplate coupling distribution along the Nankai Trough in southwest Japan estimated from the block motion model based on onshore GNSS and seafloor GNSS/A observations. Journal of Geophysical Research: Solid Earth, 124(6), 6140-6164.
-
Kubota, T., Saito, T., Tsushima, H., Hino, R., Ohta, Y., Suzuki, S., & Inazu, D. (2021). Extracting Near‐Field Seismograms From Ocean‐Bottom Pressure Gauge Inside the Focal Area: Application to the 2011 Mw 9.1 Tohoku‐Oki Earthquake. Geophysical Research Letters, 48(7), e2020GL091664.
-
Lange, D., Kopp, H., Royer, J. Y., Henry, P., Çakir, Z., Petersen, F., ... & Géli, L. (2019). Interseismic strain build-up on the submarine North Anatolian Fault offshore Istanbul. Nature communications, 10(1), 1-9.
-
Lay, T., H. Kanamori, C. J. Ammon, K. D. Koper, A. R. Hutko, L. Ye, H. Yue, T. M. Rushing (2012), Depth-varying rupture properties of subduction zone megathrust faults, Journ. Geophys. Res. 117(B4), https://doi.org/10.1029/2011JB009133.
-
Lay, T. and S. Schwartz (2004). Comment on “Coupling” Semantics and science in earthquake research. Eos, Transactions American Geophysical Union 85. doi: 10.1029/2004EO360003.
-
Lindsey, E. O., R. Mallick, J. A. Hubbard, K. E. Bradley, R. V. Almeida, J. D. P. Moore, R. Bürgmann, and E. M. Hill (2021), Slip rate deficit and earthquake potential on shallow megathrusts, Nature Geoscience, doi:10.1038/s41561-021-00736-x.
-
Liu, Y., McGuire, J.J., Behn, M.D. (2020), Aseismic transient slip on the Gofar transform fault, East Pacific Rise, Proceedings of the National Academy of Sciences May 2020, 117 (19), pp. 10188-10194.
-
Loveless, J. P., and B. J. Meade (2011). Spatial correlation of interseismic coupling and coseismic rupture extent of the 2011 Mw9 Tohoku-oki earthquake, Geophys. Res. Lett. 38, doi:10.1029/2011GL048561.
-
Mattioli, G. S., R. O. Bendick, J. H. Foster, J. T. Freymueller, P. C. La Femina, M. M. Miller, and
-
L. Rowan (2015). "The Future of the Plate Boundary Observatory in the GAGE Facility and beyond 2018." In "Final Report to the National Science Foundation EAR-1441122 July 1, 2014 to June 30, 2015." Breckenridge, CO.
-
Mazzotti, S., and J. Adams (2004), Variability of nearterm probability for the next great earthquake on the Cascadia subduction zone, Bull. Seismol. Soc. Am., 94, doi:10.1785/012004032.
-
McGuire, J.J. (2008), Seismic cycles and earthquake predictability on East Pacific Rise transform faults, Bulletin of the Seismological Society of America, 98, pp. 1067–1084.
-
McGuire, J. J., and J. A. Collins (2013), Millimeter-level precision in a seafloor geodesy experiment at the Discovery transform fault, East Pacific Rise, Geochem. Geophys. Geosyst., 14(10), 4292-4402, doi:10.1002/ggge.20225.
-
McGuire, J.J., T. Plank, et al. (2017), The SZ4D Initiative: Understanding the Processes that Underlie Subduction Zone Hazards in 4D. Vision Document Submitted to the National Science Foundation. The IRIS Consortium, 63 pp.
-
Melgar, D., Fan, W., Riquelme, S., Geng, J., Liang, C., Fuentes, M., ... & Fielding, E. J. (2016). Slip segmentation and slow rupture to the trench during the 2015, Mw8. 3 Illapel, Chile earthquake. Geophysical Research Letters, 43(3), 961-966.
-
Miller, D. J. (1960), Giant Waves in Lituya Bay, Alaska, U.S. Geological Survey Professional Paper 354-C, 86pp., doi:10.3133/pp354C.
-
Mosher and Keane (2021), Vision and Change in the Geosciences: The Future of Undergraduate Geoscience Education, American Geosciences Institute, pp 176.
-
Mulia, I. E., & Satake, K. (2021). Synthetic analysis of the efficacy of the S-net system in tsunami forecasting. Earth, Planets and Space, 73(1), 1-11.
-
Murray, J. R., Crowell, B. W., Grapenthin, R., Hodgkinson, K., Langbein, J. O., Melbourne, T., ... & Schmidt, D. A. (2018). Development of a geodetic component for the US West Coast earthquake early warning system. Seismological Research Letters, 89(6), 2322-2336.
-
Newman, A. V. (2011), Hidden Depths (a comment on the need for improved sea floor geodetic instrumentation), Nature 474, 441-443, doi:10.1038/474441a, 23 June, 2011.
-
Newman, A. V., Hayes, G., Wei, Y., and J. Convers (2011). The 25 October 2010 Mentawai tsunami earthquake, from real‐time discriminants, finite‐fault rupture, and tsunami excitation. Geophysical Research Letters, 38(5).
-
Nooner, S. L., and W. W. Chadwick, Jr. (2016), Inflation-predictable behavior and co-eruption deformation at Axial Seamount, Science, 354(6318), doi:10.1126/science.aah4666.
-
Nooner, S. L., S. C. Webb, W. R. Buck, and M.-H. Cormier (2014), Post Eruption inflation of the East Pacific Rise at 9°50' N, Geochem. Geophys. Geosyst., 15, 2676-2688, doi:10.1002/2014GC005389.
-
Osada, Y., M. Kido, and H. Fujimoto (2012), A long-term seafloor experiment using an acoustic ranging system: Precise horizontal distance measurements for detection of seafloor crustal deformation, Ocean Engineering, 51, 28-33, doi:10.1016/j.oceaneng.2012.05.006.
-
Paris, A., Okal, E. A., Guérin, C., Heinrich, P., Schindelé, F., & Hébert, H. (2019). Numerical modeling of the June 17, 2017 landslide and tsunami events in Karrat Fjord, West Greenland. Pure and Applied Geophysics, 176(7), 3035-3057.
-
Petersen, F., H. Kopp, D. Lange, K. Hannemann, and M. Urlaub (2019), Measuring tectonic seafloor deformation and strain-build up with acoustic direct-path ranging, Journal of Geodynamics, 124, 14-24, doi:https://doi.org/10.1016/j.jog.2019.01.002.
-
Phillips, K. A., C. D. Chadwell, and J. A. Hildebrand (2008), Vertical deformation measurements on the submerged south flank of Kilauea volcano, Hawai’i reveal seafloor motion associated with volcanic collapse, J. Geophys. Res., 113, B05106, doi:05110.01029/02007JB005124
-
Polet, J., Kanamori, H., 2000. Shallow subduction zone Earthquakes and their tsunamigenic potential. Geophysical J. International. 142(3), 684-702.
-
Pratt-Sitaula, B. A., Walker, B., Douglas, B. J., Charlevoix, D. J., & Miller, M. M. (2015). Undergraduate teaching modules featuring geodesy data applied to critical social topics (GETSI: GEodetic Tools for Societal Issues). In AGU Fall Meeting Abstracts (Vol. 2015, pp. ED14B-02).
-
Reece, R.S., Gulick, S.P., Christeson, G.L., Horton, B.K., van Avendonk, H. and Barth, G. (2013), The role of farfield tectonic stress in oceanic intraplate deformation, Gulf of Alaska, Journal of Geophysical Research: Solid Earth, 118(5), pp.1862-1872.
-
Ruiz, S., M. Metois, A. Fuenzalida, J. Ruiz, F. Leyton, R. Grandin, C. Vigny, R. Madariaga, and J. Campos (2014), Intense foreshocks and a slow slip event preceded the 2014 Iquique Mw 8.1 earthquake, Science, doi:10.1126/science.1256074.
-
Sahakian, V. J., Melgar, D., & Muzli, M. (2019). Weak near‐field behavior of a tsunami earthquake: Toward real‐time identification for local warning. Geophysical Research Letters, 46(16), 9519-9528.
-
Sakic, P., H. Piété, V. Ballu, J.-Y.Y. Royer, H. Kopp, D. Lange, A. Deschamps (2016). No significant steady state surface creep along the North Anatolian Fault offshore Istanbul: results of 6 months of seafloor acoustic ranging, Geophys. Res. Lett., 43 (13), pp. 6817-6825, 10.1002/2016GL069600.
-
Sasagawa G, Zumberge MA. (2013). A self-calibrating pressure recorder for detecting seafloor height change. IEEE J. Ocean. Eng. 38:447–54
-
Satake, K., & Heidarzadeh, M. (2017). A review of source models of the 2015 Illapel, Chile earthquake and insights from tsunami data. Pure and Applied Geophysics, 174(1), 1-9.
-
Sato, M., T. Ishikawa, N. Ujihara, S. Yoshida, M. Fujita, M. Mochizuki, and A. Asada (2011), Displacement Above the Hypocenter of the 2011 Tohoku-Oki Earthquake, Science, 332(6036), 1395, doi:10.1126/science.1207401.
-
Schmalzle, G.M., McCaffrey, R. and Creager, K.C., (2014). Central Cascadia subduction zone creep. Geochemistry, Geophysics, Geosystems, 15(4), pp.1515-1532.
-
Small, D. T., & Melgar, D. (2021). Geodetic coupling models as constraints on stochastic earthquake ruptures: An example application to PTHA in Cascadia. Journal of Geophysical Research: Solid Earth, 126(7), e2020JB021149.
-
Socquet, A., Hollingsworth, J., Pathier, E., & Bouchon, M. (2019). Evidence of supershear during the 2018 magnitude 7.5 Palu earthquake from space geodesy. Nat. Geosci. 12, 192–199.doi:10.1038/s41561-018-0296-0
-
Spiess, F. N. (1985), Suboceanic Geodetic Measurements, IEEE Transactions on Geoscience and Remote Sensing, GE-23(4), 502-510, doi:10.1109/TGRS.1985.289441.
-
Spiess, F. N., C. D. Chadwell, J. A. Hildebrand, L. E. Young, J. G. H. Purcell, and H. Dragert (1998), Precise GPS/acoustic positioning of seafloor reference points for tectonic studies, Phys. Earth Planet. Inter., 108, 101 – 112
-
Suwa, Y., Miura, S., Hasegawa, A., Sato, T., & Tachibana, K. (2006). Interplate coupling beneath NE Japan inferred from three‐dimensional displacement field. Journal of Geophysical Research: Solid Earth, 111(B4).
-
Suzuki, K., M. Nakano, N. Takahashi, T. Hori, S. Kamiya, E. Araki, R. Nakata, and Y. Kaneda (2016), Synchronous changes in the seismicity rate and ocean-bottom hydrostatic pressures along the Nankai trough: A possible slow slip event detected by the Dense Oceanfloor Network system for Earthquakes and Tsunamis (DONET), Tectonophysics, 680, 90-98, doi:https://doi.org/10.1016/j.tecto.2016.05.012.
-
Sweeney, A. D., Chadwell, C. D., Hildebrand, J.A., Spiess F. N., (2005), Centimeter-level positioning of seafloor acoustic transponders from a deeply-towed interrogator. Mar. Geod. 28:39–70
-
Tolstoy M, Constable S, Orcutt J, Staudigel H, Wyatt FK, Anderson G. (1998), Short and long baseline tiltmeter measurements on Axial Seamount, Juan de Fuca Ridge. Phys. Earth Planet. Inter. 108:129–41
-
Uchida, N. and Bürgmann, R., (2021). A Decade of Lessons Learned from the 2011 Tohoku‐Oki Earthquake. Reviews of Geophysics, 59(2), p.e2020RG000713.
-
Urlaub, M., F. Petersen, F. Gross, A. Bonforte, G. Puglisi, F. Guglielmino, S. Krastel, D. Lange, and H. Kopp (2018), Gravitational collapse of Mount Etna’s southeastern flank, Science Advances, 4(10), eaat9700, doi:10.1126/sciadv.aat9700.
-
Wallace, L.M., S. C. Webb, Y. Ito, K. Mochizuki, R. Hino, S. Henrys, S. Schwartz, A. Sheehan (2016), Slow slip near the trench at the Hikurangi subduction zone, Science, 352(6286), 701-704, doi: 10.1126/science.aaf2349.
-
Wallace, L. M., Hreinsdóttir, S., Ellis, S., Hamling, I., D’Anastasio, E., & Denys, P. (2018). Triggered slow slip and afterslip on the southern Hikurangi subduction zone following the Kaikōura earthquake. Geophys. Res. Lett., 45, doi.org/10.1002/2018GL077385.
-
Wallace, L.M., Saffer, D.M., Barnes, P.M., Pecher, I.A., Petronotis, K.E., LeVay, L.J., and the Expedition 372/375 Scientists (2019). Hikurangi Subduction Margin Coring, Logging, and Observatories. Proceedings of the International Ocean Discovery Program, 372B/375: College Station, TX (International Ocean Discovery Program). doi:10.14379/iodp.proc.372B375.2019.
-
Wang, K. and T. Dixon (2004). “Coupling” Semantics and science in earthquake research. Eos, Transactions American Geophysical Union 85. doi: 10.1029/2004EO180005.
-
Wilcock, W. S. D., M. Tolstoy, F. Waldhauser, C. Garcia, Y. J. Tan, D. R. Bohnenstiehl, J. Caplan-Auerbach, R. P. Dziak, A. F. Arnulf, and M. E. Mann (2016), Seismic constraints on caldera dynamics from the 2015 Axial Seamount eruption, Science, 354(6318), 1395-1399, doi:10.1126/science.aah5563.
-
Wilcock, W. S. D., D. A. Manalang, E. K. Fredrickson, M. J. Harrington, G. Cram, J. Tilley, J. Burnett, D. Martin, T. Kobayashi, and J. M. Paros (2021), A Thirty-Month Seafloor Test of the A-0-A Method for Calibrating Pressure Gauges, Frontiers in Earth Science, 8(653), doi:10.3389/feart.2020.600671.
-
Williamson, A. L., A. V. Newman (2018), Limitations of the resolvability of finite-fault models using static land-based geodesy and open-ocean tsunami waveforms, J. Geophys. Res. Solid Earth, 123, doi:10.1029/2018JB016091.
-
Williamson, A. L., Melgar, D., Crowell, B. W., Arcas, D., Melbourne, T. I., Wei, Y., & Kwong, K. (2020). Toward near‐field tsunami forecasting along the Cascadia subduction zone using rapid GNSS source models. Journal of Geophysical Research: Solid Earth, 125(8), e2020JB019636.
-
Woods, K. Wallace, L.M. Webb, S.C. Ito, Y. Savage, M.K. Chadwell, C.D. Williams, C.A. Hino,
-
R. Mochizuki, K, Warren-Smith, E. Barker, D.H.N. (2020). Updip Migration of Slow Slip Revealed Through Seafloor Geodesy during 2019 East Coast Slow Slip at the Hikurangi Margin, New Zealand. in AGU Fall Meeting 2020.
-
Xie, S., Law, J., Russell, R., Dixon, T. H., Lembke, C., Malservisi, R., et al. (2019). Seafloor Geodesy in Shallow Water With GPS on an Anchored Spar Buoy. Journal of Geophysical Research: Solid Earth, 124(11), 12116–12140. doi:10.1029/2019jb018242.
-
Yamamoto, Y., Takahashi, N., Pinar, A., Kalafat, D., Citak, S., Comoglu, M., Polat, R., and Kaneda, Y. (2017), Geometry and segmentation of the North Anatolian Fault beneath the Marmara Sea, Turkey, deduced from long-term ocean bottom seismographic observations, J. Geophys. Res. Solid Earth, 122, 2069– 2084, doi:10.1002/2016JB013608.
-
Yohler, R., Bartlow, N., Wallace, L. M., & Williams, C. (2019). Time‐dependent behavior of a near‐trench slow‐slip event at the Hikurangi subduction zone. Geochemistry, Geophysics, Geosystems, 20(8), 4292-4304.
-
Yokota, Y., T. Ishikawa, S.-I. Watanabe, T. Tashiro, and A. Asada (2016), Seafloor geodetic constraints on interplate coupling of the Nankai Trough megathrust zone, Nature, doi:10.1038/nature17632.
-
Yokota, Y. and T. Ishikawa (2020), Shallow slow slip events along the Nankai Trough detected by GNSS-A, Science Advances, 6(3), DOI: 10.1126/sciadv.aay5786.
-
Yue, H., Lay, T., Rivera, L., Bai, Y., Yamazaki, Y., Cheung, K. F., ... & Muhari, A. (2014). Rupture process of the 2010 Mw 7.8 Mentawai tsunami earthquake from joint inversion of near‐field hr‐GPS and teleseismic body wave recordings constrained by tsunami observations. Journal of Geophysical Research: Solid Earth, 119(7), 5574-5593.
-
Zumberge M. (1997), Precise optical path length measurement through an optical fiber: application to seafloor strain monitoring. Ocean Eng. 24:532–42.
-
Zumberge M, Alnes H, Eiken O, Sasagawa G, Stenvold T. (2008), Precision of seafloor gravity and pressure measurements for reservoir monitoring. Geophysics 73:WA133–41.
-
Zumberge, M. A., Hatfield, W., & Wyatt, F. K. (2018). Measuring seafloor strain with an optical fiber interferometer. Earth and Space Science. doi:10.1029/2018EA000418.